- the peak load rate is 2X better with WiredTiger in 3.2 vs 3.0
- the load rate for WiredTiger is much better than for RocksDB
- the load rate for WiredTiger and RocksDB does not get slower with disk vs SSD or with a cached database vs an uncached database. For RocksDB this occurs because secondary index maintenance doesn't require page reads. This might be true for WiredTiger only because the secondary index pages fit in cache.
- the peak query rates were between 2X and 3X better for RocksDB vs WiredTiger
Configuration
The previous post explains the benchmark and test hardware. The test was repeated for 1, 4, 8, 16 and 24 concurrent clients for the disk array test and 1, 4, 8, 12, 16, 20 and 24 concurrent clients for the SSD test.Load performance
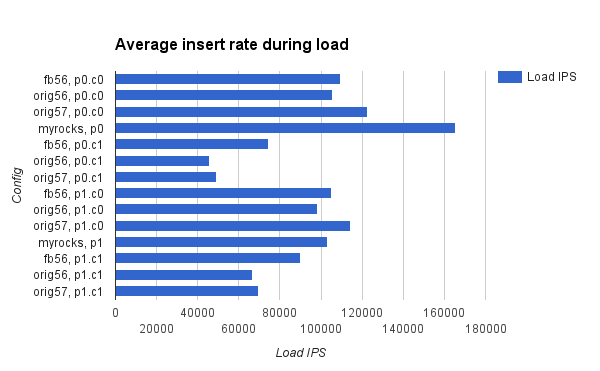
I only show the insert rate graph for SSD. The results with the disk array are similar. The insert rate is better for WiredTiger because it supports more concurrency internally courtesy of extremely impressive engineering. We have work in progress to make this much better for RocksDB.

Query performance
These display the query rates for 1, 4, 8, 16 and 24 concurrent clients using a disk array and then SSD. RocksDB does better than WiredTiger on both disk and SSD. RocksDB uses less random IO when writing changes back to storage and the benefit from this is larger with disk than with an SSD so the speedup for RocksDB is larger with the disk array.

Efficiency
This includes absolute and relative efficiency metrics from the tests run with 16 concurrent clients and SSD. The values are from vmstat and iostat run for the duration of the test. The absolute metrics are the per-second rates. The relative metrics are the per-second rates divided by the operation rate which measures HW consumed per insert or query. The operation rate is either the load rate (IPS) or the query rate (QPS).The columns are:
- cs.sec - average context switch rate
- cpu.sec - average CPU load (system + user CPU time)
- cs.op - context switch rate / operation rate
- cpu.Kop - (CPU load / operation rate) X 1000
- r.sec - average rate for iostat r/s
- rkb.sec - average rate for iostat rKB/s
- wkb.sec - average rate for iostat wKB/s
- r.op - r.sec / operation rate
- rkb.op - rkb.sec / operation rate
- wkb.op - w.sec / operation rate
Load Efficiency
Conclusions from efficiency on the load step:- The context switch and CPU overheads are larger with RocksDB. This might be from mutex contention
- I need more precision to show this but the relative write rate is much better for WiredTiger
- The relative read rate is much better for WiredTiger. I suspect that some data is being read during compaction by RocksDB.
cs.sec cpu.sec cs.op cpu.Kop r.sec rkb.sec wkb.sec r.op rkb.op wkb.op engine
182210 43 21.8 5.176 7.7 41 100149 0.001 0.005 0.000 RocksDB
108230 68 4.3 2.721 0.5 4 58327 0.000 0.000 0.000 WiredTiger
Query Efficiency
Conclusions from efficiency on the query step:
- The CPU overheads are similar
- The read and write overheads are larger for WiredTiger. RocksDB sustains more QPS because it does less IO for an IO-bound workload.
cs.sec cpu.sec cs.op cpu.Kop r.sec rkb.sec wkb.sec r.op rkb.op wkb.op engine
87075 53 4.6 2.772 6394.2 52516 27295 0.338 2.774 1.442 RocksDB
65889 40 5.5 3.320 6309.8 88675 50559 0.529 7.437 4.240 WiredTiger
Results for disk
Results at 1, 4, 8, 16 and 24 concurrent clients for RocksDB and WiredTiger. IPS is the average insert rate during the load phase and QPS is the average query rate during the query phase.
clients IPS QPS RocksDB
1 3781 281
4 12397 1244
8 16717 1946
16 19116 2259
24 17627 2458
clients IPS QPS WiredTiger
1 5080 227
4 18369 726
8 35272 843
16 55341 808
24 64577 813
Results for SSD
Results at 1, 4, 8, 12, 16, 20 and 24 concurrent clients for RocksDB and WiredTiger. IPS is the average insert rate during the load phase and QPS is the average query rate during the query phase.
clients IPS QPS RocksDB
1 3772 945
4 12475 3171
8 16689 6023
12 18079 8075
16 18248 9632
20 18328 10440
24 17327 10500
clients IPS QPS WiredTiger
1 5077 843
4 18511 2627
8 35471 4374
12 43105 5435
16 55108 6067
20 62380 5928
24 64190 5762
Response time
This has per-operation response time metrics that are printed by Linkbench at the end of a test run. These are from the SSD test with 16 clients. While the throughput is about 1.5X better for RocksDB the p99 latencies tend to be 2X better with it. It isn't clear whether the stalls are from WiredTiger or storage.For RocksDB:
ADD_NODE count = 893692 p50 = [0.2,0.3]ms p99 = [3,4]ms max = 262.96ms mean = 0.37ms
UPDATE_NODE count = 2556755 p50 = [0.8,0.9]ms p99 = [10,11]ms max = 280.701ms mean = 1.199ms
DELETE_NODE count = 351389 p50 = [0.8,0.9]ms p99 = [11,12]ms max = 242.851ms mean = 1.303ms
GET_NODE count = 4484357 p50 = [0.5,0.6]ms p99 = [9,10]ms max = 262.863ms mean = 0.798ms
ADD_LINK count = 3119609 p50 = [1,2]ms p99 = [13,14]ms max = 271.504ms mean = 2.211ms
DELETE_LINK count = 1038625 p50 = [0.6,0.7]ms p99 = [13,14]ms max = 274.327ms mean = 1.789ms
UPDATE_LINK count = 2779251 p50 = [1,2]ms p99 = [13,14]ms max = 265.854ms mean = 2.354ms
COUNT_LINK count = 1696924 p50 = [0.3,0.4]ms p99 = [3,4]ms max = 262.514ms mean = 0.455ms
MULTIGET_LINK count = 182741 p50 = [0.7,0.8]ms p99 = [6,7]ms max = 237.901ms mean = 1.023ms
GET_LINKS_LIST count = 17592675 p50 = [0.8,0.9]ms p99 = [11,12]ms max = 26278.336ms mean = 1.631ms
REQUEST PHASE COMPLETED. 34696018 requests done in 3601 seconds. Requests/second = 9632
For WiredTiger:
ADD_NODE count = 562034 p50 = [0.2,0.3]ms p99 = [0.6,0.7]ms max = 687.348ms mean = 0.322ms
UPDATE_NODE count = 1609307 p50 = [1,2]ms p99 = [20,21]ms max = 1331.321ms mean = 1.761ms
DELETE_NODE count = 222067 p50 = [1,2]ms p99 = [20,21]ms max = 1116.159ms mean = 1.813ms
GET_NODE count = 2827037 p50 = [0.8,0.9]ms p99 = [19,20]ms max = 1119.06ms mean = 1.51ms
ADD_LINK count = 1963502 p50 = [2,3]ms p99 = [27,28]ms max = 1176.684ms mean = 3.324ms
DELETE_LINK count = 654387 p50 = [1,2]ms p99 = [21,22]ms max = 1292.405ms mean = 2.761ms
UPDATE_LINK count = 1752325 p50 = [2,3]ms p99 = [30,31]ms max = 4783.055ms mean = 3.623ms
COUNT_LINK count = 1068844 p50 = [0.3,0.4]ms p99 = [4,5]ms max = 1264.399ms mean = 0.705ms
MULTIGET_LINK count = 114870 p50 = [1,2]ms p99 = [17,18]ms max = 466.058ms mean = 1.717ms
GET_LINKS_LIST count = 11081761 p50 = [1,2]ms p99 = [21,22]ms max = 19840.669ms mean = 2.624ms
REQUEST PHASE COMPLETED. 21856135 requests done in 3602 seconds. Requests/second = 6067