This post has results for the Insert Benchmark on a small server with a cached workload. The goal is to compare new Postgres releases with older ones to determine whether they get better or worse over time. The results here are from the newest small servers in my test cluster -- an ASUS PN53.
This work was done by Small Datum LLC.
The workload here has low concurrency (1 or 4 clients) and the database is cached. The results might be different when the workload is IO-bound or has more concurrency. Results were recently shared from tests run on an older small server.
tl;dr
- There are no regressions from Postgres 16.3 to 17beta1 for this benchmark
- All Postgres versions have too much variance on the insert rate for the l.i1 and l.i2 benchmark steps. While tuning fixes that is a too frequent response, I spent much time trying to fix this via tuning last year without success. This has not been a problem for modern MySQL and one example is here (equivalent Postgres graphs are here). The issue is explained below.
- The builtin provider might have improved performance on two of the benchmark steps (l.i1, l.i2) when comparing Postgres 17beta1 with and without it. But I need to repeat the benchmark to confirm that the result isn't just noise.
Build + Configuration
This post has results from Postgres versions 10.23, 11.22, 12.19, 13.15, 14.12, 15.7, 16.3 and 17beta1. All were compiled from source. I used configurations that are as similar as possible but I won't have access to the test machines for a few days. The config for 16.3 is here.
For Postgres 17beta1 I have results for two different configs (cx9a2_c8r32, cx9a2lc_c8r32). But they really are the same config. The difference is in the flags to initdb:
- cx9a2_c8r32 - --data-checksums
- cx9a2lc_c8r32 - --data-checksums --locale-provider=builtin --builtin-local=C.UTF-8
This was done to see if the changes in 17beta1 for the builtin local provider impact performance. The output from running initdb for Postgres 17beta1 is here.
The Benchmark
The benchmark is run with 1 client, a cached workload and 1 table. It is explained here.
The test server was named v8 here and is an ASUS PN53. It has 8 cores, 32G RAM, Ubuntu 22.04 and XFS using 1 m.2 device.
The benchmark steps are:
- l.i0
- insert 50 million rows in PK order. The table has a PK index but no secondary indexes. There is one connection per client.
- l.x
- create 3 secondary indexes per table. There is one connection per client.
- l.i1
- use 2 connections/client. One inserts 40M rows and the other does deletes at the same rate as the inserts. Each transaction modifies 50 rows (big transactions). This step is run for a fixed number of inserts, so the run time varies depending on the insert rate.
- l.i2
- like l.i1 but each transaction modifies 5 rows (small transactions) and 10M rows are inserted and deleted.
- Wait for X seconds after the step finishes to reduce variance during the read-write benchmark steps that follow. The value of X is a function of the table size.
- qr100
- use 3 connections/client. One does range queries and performance is reported for this. The second does does 100 inserts/s and the third does 100 deletes/s. The second and third are less busy than the first. The range queries use covering secondary indexes. This step is run for 1800 seconds. If the target insert rate is not sustained then that is considered to be an SLA failure. If the target insert rate is sustained then the step does the same number of inserts for all systems tested.
- qp100
- like qr100 except uses point queries on the PK index
- qr500
- like qr100 but the insert and delete rates are increased from 100/s to 500/s
- qp500
- like qp100 but the insert and delete rates are increased from 100/s to 500/s
- qr1000
- like qr100 but the insert and delete rates are increased from 100/s to 1000/s
- qp1000
- like qp100 but the insert and delete rates are increased from 100/s to 1000/s
Results
The performance report is here.
The summary in each performance report has 3 tables. The first shows absolute throughput by DBMS tested X benchmark step. The second has throughput relative to the version from the first row of the table. The third shows the background insert rate for benchmark steps with background inserts and all systems sustained the target rates. The second table makes it easy to see how performance changes over time. The third table makes it easy to see which DBMS+configs failed to meet the SLA.
Below I use relative QPS to explain how performance changes. It is: (QPS for $me / QPS for $base) where $me is my version and $base is the version of the base case. When relative QPS is > 1.0 then performance improved over time. When it is < 1.0 then there are regressions. The Q in relative QPS measures:
- insert/s for l.i0, l.i1, l.i2
- indexed rows/s for l.x
- range queries/s for qr100, qr500, qr1000
- point queries/s for qp100, qp500, qp1000
Below I use colors to highlight the relative QPS values with red for <= 0.95, green for >= 1.05 and grey for values between 0.95 and 1.05.
Results: Postgres
The base case is Postgres 10.23 with the cx9a2_c8r32 config (pg1023_def.cx9a2_c8r32). It is compared with:
- Postgres 16.3 with the cx9a2_c8r32 config (pg163_def.cx9a2_c8r32)
- Postgres 17beta1 with the cx9a2_c8r32 config (pg17beta1_def.cx9a2_c8r32)
- Postgres 17beta1 with the cx9a2lc_c8r32 config (pg17beta1_def.cx9a2lc_c8r32) that uses the builtin locale provider
tl;dr
- Postgres 16.3 and 17beta1 have similar performance
- It isn't clear that the builtin provider helps this benchmark
- The results for l.i1 and l.i2 should be revisited to explain why 17beta1 without the builtin locale provider didn't do better
From the summary the relative throughput per benchmark step is:
- l.i0
- relative QPS is 1.14 in PG 16.3
- relative QPS is 1.18 in PG 17beta1 without the builtin locale
- relative QPS is 1.18 in PG 17beta1 with the builtin locale
- l.x - I ignore this for now
- l.i1, l.i2
- relative QPS is 2.23, 2.27 in PG 16.3
- relative QPS is 1.99, 2.00 in PG 17beta1 without the builtin locale
- relative QPS is 2.29, 2.22 in PG 17beta1 with the builtin locale
- qr100, qr500, qr1000
- relative QPS is 1.03, 1.08, 1.08 in PG 16.3
- relative QPS is 1.04, 1.07, 1.08 in PG 17beta1 without the builtin locale
- relative QPS is 1.05, 1.07, 1.07 in PG 17beta1 with the builtin locale
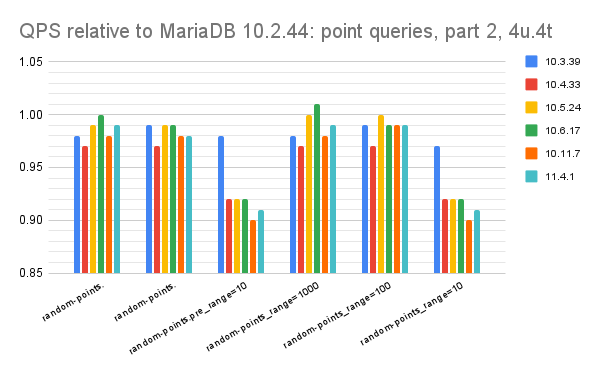
- qp100, qp500, qp1000
- relative QPS is 0.98, 0.98, 0.97 in PG 16.3
- relative QPS is 0.97, 0.98, 0.97 in PG 17beta1 without the builtin locale
- relative QPS is 0.96, 0.97, 0.96 in PG 17beta1 with the builtin locale
Metrics
Metrics for each of the benchmark steps starts here. By metrics I mean mostly counters from iostat and vmstat normalized by the insert or query rates. These help to explain differences in performance and spot where something is using more or less HW per operation. Here I focus on the metrics for the l.i1 and l.i2 benchmark steps because that is where there is a difference for Postgres 17beta1 with and without the builtin locale provider.
The thing to explain is that the insert (and delete) rates sustained by Postgres 17beta1 with the builtin locale provider are better than without it. Note that the benchmark client is setup so that the insert and delete rates are coupled -- they are programmed to run at the same rate. The difference in the results here is about 15%. The most interesting difference in the metrics for l.i1 is in the CPU/operation (cpupq) column where it about 8% larger without the builtin locale provider (127 vs 117).
The other interesting result is that the number of context switches per operation (cspq) is about 15% smaller in Postgres 17beta1 vs 16.3. This is a good change, but I want to see more results before I am certain about it.
The other interesting result is that the number of context switches per operation (cspq) is about 15% smaller in Postgres 17beta1 vs 16.3. This is a good change, but I want to see more results before I am certain about it.
Variance
All Postgres versions have too much variance on the insert rate for the l.i1 and l.i2 benchmark steps -- see the graphs for insert/s vs time here (IPS == inserts/s, DPS == deletes/s). While tuning fixes that is a too frequent response, I spent much time trying to fix this via tuning last year without success. This has not been a problem for modern MySQL and one example is here (equivalent Postgres graphs are here).
The response time histograms for l.i1 makes this easier to understand. The histograms are great for inserts but lousy for deletes. The problems is explained in this Twitter thread and blog post. The issue is that the Postgres optimizer probes an index to figure out the min value for a column in some cases, and while this part of the benchmark isn't written in the best way, I still prefer that Postgres do better here and get_actual_variable_range is the culprit.
I updated the Insert Benchmark last year to add deletes at the same rate as inserts for the l.i1 and l.i2 benchmark steps to avoid growing the database. And Postgres was much less happy with that change when compared to MySQL. Note that MySQL with InnoDB often probes indexes to determine predicate selectivity. The real issue here is the number of dead index entries that must be skipped to find the first live entry while figuring out the min value.