This has results for the Insert Benchmark on a small server with InnoDB from MySQL 5.6 through 9.4. The workload here uses low concurrency (1 client), a small server and a cached database. I run it this way to look for CPU regressions before moving on to IO-bound workloads with high concurrency.
tl;dr
- good news - there are no large regressions after MySQL 8.0
- bad news - there are large regressions from MySQL 5.6 to 5.7 to 8.0
- load in 8.0, 8.4 and 9.4 gets about 60% of the throughput vs 5.6
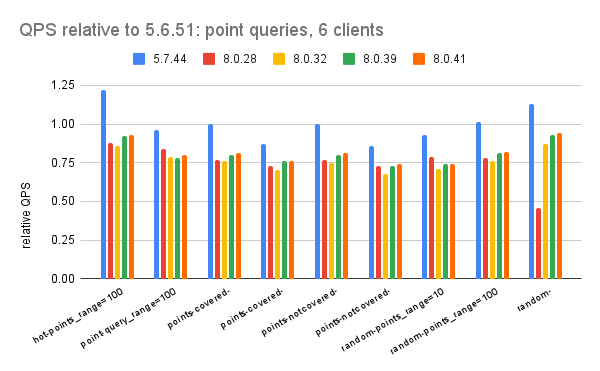
- queries in 8.0, 8.4 and 9.4 get between 60% and 70% of the throughput vs 5.6
Builds, configuration and hardware
I compiled MySQL 5.6.51, 5.7.44, 8.0.43, 8.4.6 and 9.4.0 from source.
The Benchmark
The benchmark is explained here. I recently updated the benchmark client to connect via socket rather than TCP so that I can get non-SSL connections for all versions tested. AFAIK, with TCP I can only get SSL connections for MySQL 8.4 and 9.4.
The workload uses 1 client, 1 table with 30M rows and a cached database.
The benchmark steps are:
- l.i0
- insert 30 million rows per table in PK order. The table has a PK index but no secondary indexes. There is one connection per client.
- l.x
- create 3 secondary indexes per table. There is one connection per client.
- l.i1
- use 2 connections/client. One inserts 40 million rows per table and the other does deletes at the same rate as the inserts. Each transaction modifies 50 rows (big transactions). This step is run for a fixed number of inserts, so the run time varies depending on the insert rate.
- l.i2
- like l.i1 but each transaction modifies 5 rows (small transactions) and 10 million rows are inserted and deleted per table.
- Wait for N seconds after the step finishes to reduce variance during the read-write benchmark steps that follow. The value of N is a function of the table size.
- qr100
- use 3 connections/client. One does range queries and performance is reported for this. The second does does 100 inserts/s and the third does 100 deletes/s. The second and third are less busy than the first. The range queries use covering secondary indexes. This step is run for 1800 seconds. If the target insert rate is not sustained then that is considered to be an SLA failure. If the target insert rate is sustained then the step does the same number of inserts for all systems tested.
- qp100
- like qr100 except uses point queries on the PK index
- qr500
- like qr100 but the insert and delete rates are increased from 100/s to 500/s
- qp500
- like qp100 but the insert and delete rates are increased from 100/s to 500/s
- qr1000
- like qr100 but the insert and delete rates are increased from 100/s to 1000/s
- qp1000
- like qp100 but the insert and delete rates are increased from 100/s to 1000/s
Results: overview
The performance report is here.
The summary section has 3 tables. The first shows absolute throughput by DBMS tested X benchmark step. The second has throughput relative to the version from the first row of the table. The third shows the background insert rate for benchmark steps with background inserts. The second table makes it easy to see how performance changes over time. The third table makes it easy to see which DBMS+configs failed to meet the SLA. The summary section is here.
Below I use relative QPS (rQPS) to explain how performance changes. It is: (QPS for $me / QPS for $base) where $me is the result for some version $base is the result from MySQL 5.6.51.
When rQPS is > 1.0 then performance improved over time. When it is < 1.0 then there are regressions. When it is 0.90 then I claim there is a 10% regression. The Q in relative QPS measures:
- insert/s for l.i0, l.i1, l.i2
- indexed rows/s for l.x
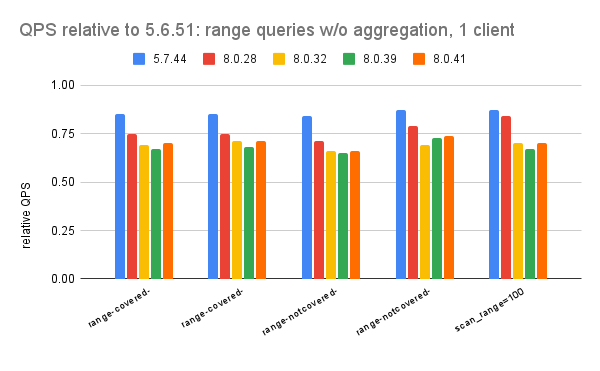
- range queries/s for qr100, qr500, qr1000
- point queries/s for qp100, qp500, qp1000
Below I use colors to highlight the relative QPS values with yellow for regressions and blue for improvements.
Results: details
This table is a copy of the second table in the summary section. It lists the relative QPS (rQPS) for each benchmark step where rQPS is explained above.
The benchmark steps are explained above, they are:
- l.i0 - initial load in PK order
- l.x - create 3 secondary indexes per table
- l.i1, l.i2 - random inserts and random deletes
- qr100, qr500, qr1000 - short range queries with background writes
- qp100, qp500, qp1000 - point queries with background writes
| dbms | l.i0 | l.x | l.i1 | l.i2 | qr100 | qp100 | qr500 | qp500 | qr1000 | qp1000 |
|---|---|---|---|---|---|---|---|---|---|---|
| 5.6.51 | 1.00 | 1.00 | 1.00 | 1.00 | 1.00 | 1.00 | 1.00 | 1.00 | 1.00 | 1.00 |
| 5.7.44 | 0.89 | 1.52 | 1.14 | 1.08 | 0.83 | 0.84 | 0.83 | 0.84 | 0.84 | 0.84 |
| 8.0.43 | 0.60 | 2.50 | 1.04 | 0.86 | 0.69 | 0.62 | 0.69 | 0.63 | 0.70 | 0.62 |
| 8.4.6 | 0.60 | 2.53 | 1.03 | 0.86 | 0.68 | 0.61 | 0.67 | 0.61 | 0.68 | 0.61 |
| 9.4.0 | 0.60 | 2.53 | 1.03 | 0.87 | 0.70 | 0.63 | 0.70 | 0.63 | 0.70 | 0.62 |
The summary is:
- l.i0
- there are large regressions starting in 8.0 and modern MySQL only gets ~60% of the throughput relative to 5.6 because modern MySQL has more CPU overhead
- l.x
- I ignore this but there have been improvements
- l.i1, l.i2
- there was a large improvement in 5.7 but new CPU overhead since 8.0 reduces that
- qr100, qr500, qr1000
- there are large regressions from 5.6 to 5.7 and then again from 5.7 to 8.0
- throughput in modern MySQL is ~60% to 70% of what it was in 5.6