Friday, June 14, 2024

The Insert Benchmark vs MyRocks and InnoDB, small server, IO-bound database

This has results from the Insert Benchmark for many versions of MyRocks and MySQL (InnoDB)  on a small server with an IO-bound database and low-concurrency workload. It complements the results from the same setup but with a cached database.

The goal here is to document performance regressions over time for both upstream MySQL with InnoDB and FB MyRocks. If they get slower at a similar rate from MySQL 5.6 to 8.0 then the culprit is code above the storage engine. Otherwise, the regressions are from the storage engine.

tl;dr

  • MyRocks and InnoDB have similar throughput on the initial load (l.i0). Something changed from MyRocks 5.6 to MyRocks 8.0 that increases write-amp.
  • MyRocks is much faster on random writes (l.i1, l.i2) thanks to read free secondary index maintenance
  • InnoDB gets more range-query QPS (qr100, ...) because MyRocks uses a lot more CPU per query
  • MyRocks gets more point-query QPS (qp100, ...) thanks to bloom filters

Build + Configuration

All DBMS were compiled from source.

I tested InnoDB from upstream MySQL 5.6.51, 5.7.44, 8.0.28, 8.0.32, 8.0.36 and 8.0.37. 

I tested MyRocks from FB MySQL 5.6.35, 8.0.28 and 8.0.32.
The my.cnf files are here for the SER4 server.

The Benchmark

The benchmark is run with 1 client, a cached workload and 1 table. It is explained here.

While the results for the cached database used two types of servers (SER4, PN53), here I only have results from SER4. The SER4 server has 8 cores and 16G of RAM and is named v3 here. It uses Ubuntu 22.04 and XFS with 1 m.2 device.

The benchmark steps are:

  • l.i0
    • insert 800 million rows in PK order. The table has a PK index but no secondary indexes. There is one connection per client.
  • l.x
    • create 3 secondary indexes per table. There is one connection per client.
  • l.i1
    • use 2 connections/client. One inserts 40M rows and the other does deletes at the same rate as the inserts. Each transaction modifies 50 rows (big transactions). This step is run for a fixed number of inserts, so the run time varies depending on the insert rate.
  • l.i2
    • like l.i1 but each transaction modifies 5 rows (small transactions) and 10M rows are inserted and deleted.
    • Wait for X seconds after the step finishes to reduce variance during the read-write benchmark steps that follow. The value of X is a function of the table size.
  • qr100
    • use 3 connections/client. One does range queries and performance is reported for this. The second does does 100 inserts/s and the third does 100 deletes/s. The second and third are less busy than the first. The range queries use covering secondary indexes. This step is run for 1800 seconds. If the target insert rate is not sustained then that is considered to be an SLA failure. If the target insert rate is sustained then the step does the same number of inserts for all systems tested.
  • qp100
    • like qr100 except uses point queries on the PK index
  • qr500
    • like qr100 but the insert and delete rates are increased from 100/s to 500/s
  • qp500
    • like qp100 but the insert and delete rates are increased from 100/s to 500/s
  • qr1000
    • like qr100 but the insert and delete rates are increased from 100/s to 1000/s
  • qp1000
    • like qp100 but the insert and delete rates are increased from 100/s to 1000/s
Results

The performance reports are here: all DBMS, MyRocks only, InnoDB only, MyRocks vs InnoDB.

The summary in each performance report has 3 tables. The first shows absolute throughput by DBMS tested X benchmark step. The second has throughput relative to the version from the first row of the table. The third shows the background insert rate for benchmark steps with background inserts and all systems sustained the target rates. The second table makes it easy to see how performance changes over time. The third table makes it easy to see which DBMS+configs failed to meet the SLA.

Below I use relative QPS to explain how performance changes. It is: (QPS for $me / QPS for $base) where $me is my version and $base is the version of the base case. When relative QPS is > 1.0 then performance improved over time. When it is < 1.0 then there are regressions. The Q in relative QPS measures: 
  • insert/s for l.i0, l.i1, l.i2
  • indexed rows/s for l.x
  • range queries/s for qr100, qr500, qr1000
  • point queries/s for qp100, qp500, qp1000
Below I use colors to highlight the relative QPS values with red for <= 0.95, green for >= 1.05 and grey for values between 0.95 and 1.05.

Results: InnoDB

The base case is MySQL 5.6.51 - my5651_rel.cz11a_bee.

It is compared with MySQL 5.7.44 and 8.0.37 - my5744_rel.cz11a_bee, my8037_rel.cz11a_bee.

tl;dr
  • Results from MySQL 5.6.51 were not great and much was improved for InnoDB in MySQL 5.7
  • MySQL 8.0 suffers from more CPU overhead, see the cpupq column here (CPU/operation)
From the summary the relative throughput per benchmark step is:
  • l.i0
    • relative QPS is 0.83 in 5.7.44
    • relative QPS is 0.55 in 8.0.37
  • l.x - I ignore this for now
  • l.i1, l.i2
    • relative QPS is 1.751.62 in 5.7.44
    • relative QPS is 2.470.70 in 8.0.37
  • qr100, qr500, qr1000
    • relative QPS is 0.760.830.95 in 5.7.44
    • relative QPS is 0.700.760.87 in 8.0.37
  • qp100, qp500, qp1000
    • relative QPS is 0.971.03, 1.28 in 5.7.44
    • relative QPS is 0.931.011.26 in 8.0.37
Results: MyRocks

The base case is MyRocks 5.6.35 - fbmy5635_rel_240606_4f3a57a1.cza1_bee. Note that MyRocks 5.6.35 and 8.0.28 here use RocksDB version 8.7.0 while MyRocks 8.0.32 used RocksDB version 9.3.1.

The base case is compared with MyRocks 8.0.28 and 8.0.32 
  • fbmy8028_rel_240606_c6c83b18.cza1_bee
  • fbmy8032_rel_240606_59f03d5a.cza1_bee
tl;dr
  • l.i0
    • 8.0.28 and 8.0.32 use more CPU (cpupq is CPU/insert) - see here
    • 8.0.28 and 8.0.32 write-amp (wkbpi is KB written to storage/insert) - see here and from the compaction IO stats taken at the end of the benchmark step the extra writes are done to logical L1 (physical name is L4). I am confused because both 5.6.35 and 8.0.28 use RocksDB version 8.7.0 but it looks like trivial move wasn't used as expected for MyRocks 8.0
    • Max insert response time charts are much better for 5.6.35 than for 8.0.28 or 8.0.32
  • l.i1
    • 8.0.32 has more write-amp (wkbpi is KB written to storage/insert) - see here.
    • 8.0.32 does better at avoiding write stalls than 5.6.35 or 8.0.28
  • l.i2
    • 8.0.32 has more write-amp (wkbpi is KB written to storage/insert) - see here.
    • 8.0.32 does better at avoiding write stalls than 5.6.35 or 8.0.28
  • qr100, qr500, qr1000
    • Results here have more variance, but 8.0.28 and 8.0.32 often use more CPU (cpupq) and do more reads from storage (rkbpi, rpq) relative to 5.6.35. Perhaps I need to run these benchmark steps for longer than 1800 seconds to reduce the variance. Metrics are here.
  • qp100, qp500, qp1000
    • 8.0.28 and 8.0.32 use more CPU (cpupq) - see here.
From the summary the relative throughput per benchmark step is:
  • l.i0
    • relative QPS is 0.73 in 8.0.28
    • relative QPS is 0.68 in 8.0.32
  • l.x - I ignore this for now
  • l.i1, l.i2
    • relative QPS is 0.880.98 in 8.0.28
    • relative QPS is 1.291.29 in 8.0.32
  • qr100, qr500, qr1000
    • relative QPS is 0.720.360.72 in 8.0.28
    • relative QPS is 0.530.660.98 in 8.0.32
  • qp100, qp500, qp1000
    • relative QPS is 0.870.890.89 in 8.0.28
    • relative QPS is 0.910.920.92 in 8.0.32
Results: MyRocks vs InnoDB

The base case is MySQL 8.0.32 - my8032_rel.cz11a_bee.
It is compared with MyRocks 8.0.32 - fbmy8032_rel_240606_59f03d5a.cza1_bee.

tl;dr 
  • l.i0
    • Per insert, InnoDB and MyRocks use a similar amount of CPU (cpupq) but InnoDB writes ~2X more to storage (wkbpi) - see here
  • l.i1, l.i2
    • MyRocks benefits a lot from read free secondary index maintenance because InnoDB does ~20X more IO (rkbpi, wkbpi) than MyRocks - see here
  • qr100, qr500, qr1000 
    • Relative too each other, InnoDB uses too much read and write IO (rkbpi, wkbpi) while MyRocks uses too much CPU (cpupq) - see here. In this case the CPU overhead is the bottleneck and InnoDB gets more QPS. For reasons I don't fully understand, InnoDB struggles to cache the indexes here while MyRocks and Postgres do not.
  • qp100, qp500, qp1000
    • InnoDB uses more CPU (cpuqpq) and does more IO (rkbpi, wkibpi) - see here
From the summary the relative throughput per benchmark step is:
  • l.i0
    • relative QPS is 0.97 in MyRocks 8.0.32
  • l.x - I ignore this for now
  • l.i1, l.i2
    • relative QPS is 5.115.44 in MyRocks 8.0.32
  • qr100, qr500, qr1000
    • relative QPS is 0.160.320.25 in MyRocks 8.0.32
  • qp100, qp500, qp1000
    • relative QPS is 1.22, 1.31, 1.39 in MyRocks 8.0.32

Wednesday, June 12, 2024

The Insert Benchmark vs MyRocks and InnoDB, small server, cached database

This has results from the Insert Benchmark for many versions of MyRocks and MySQL (InnoDB)  on a small server with a cached database and low-concurrency workload.

The goal here is to document performance regressions over time for both upstream MySQL with InnoDB and FB MyRocks. If they get slower at a similar rate from MySQL 5.6 to 8.0 then the culprit is code above the storage engine. Otherwise, the regressions are from the storage engine.

tl;dr

  • Regressions from 5.6 to 8.0 are worse for InnoDB than for MyRocks
  • InnoDB is faster than MyRocks here because the workload is CPU-bound and InnoDB uses less CPU than MyRocks. A result from an IO-bound setup will be different.
  • The worst case for MyRocks vs InnoDB here is on the range query benchmark steps (qr100, qr500, qr1000) because range queries with an LSM usually don't benefit from a bloom filter and do suffer from merging iterators -- which all increases the CPU overhead.
  • I need to spend more time getting flamegraphs to document the differences.
Build + Configuration

All DBMS were compiled from source.

I tested InnoDB from upstream MySQL 5.6.51, 5.7.44, 8.0.28, 8.0.32, 8.0.36 and 8.0.37. 

I tested MyRocks from FB MySQL 5.6.35, 8.0.28 and 8.0.32.
The my.cnf files are here for the SER4 and the PN53 servers.

The Benchmark

The benchmark is run with 1 client, a cached workload and 1 table. It is explained here.

There were two server types. The SER4 server has 8 cores and 16G of RAM and is named v3 here. The PN53 has 8 cores and 32G of RAM and is named v8 here. Both have Ubuntu 22.04 and use XFS with 1 m.2 device.

The benchmark steps are:

  • l.i0
    • insert X million rows in PK order. The table has a PK index but no secondary indexes. There is one connection per client. The value of X is 20M for SER4 and 30M for PN53.
  • l.x
    • create 3 secondary indexes per table. There is one connection per client.
  • l.i1
    • use 2 connections/client. One inserts 40M rows and the other does deletes at the same rate as the inserts. Each transaction modifies 50 rows (big transactions). This step is run for a fixed number of inserts, so the run time varies depending on the insert rate.
  • l.i2
    • like l.i1 but each transaction modifies 5 rows (small transactions) and 10M rows are inserted and deleted.
    • Wait for X seconds after the step finishes to reduce variance during the read-write benchmark steps that follow. The value of X is a function of the table size.
  • qr100
    • use 3 connections/client. One does range queries and performance is reported for this. The second does does 100 inserts/s and the third does 100 deletes/s. The second and third are less busy than the first. The range queries use covering secondary indexes. This step is run for 1800 seconds. If the target insert rate is not sustained then that is considered to be an SLA failure. If the target insert rate is sustained then the step does the same number of inserts for all systems tested.
  • qp100
    • like qr100 except uses point queries on the PK index
  • qr500
    • like qr100 but the insert and delete rates are increased from 100/s to 500/s
  • qp500
    • like qp100 but the insert and delete rates are increased from 100/s to 500/s
  • qr1000
    • like qr100 but the insert and delete rates are increased from 100/s to 1000/s
  • qp1000
    • like qp100 but the insert and delete rates are increased from 100/s to 1000/s
Results

The performance reports are here:
The summary in each performance report has 3 tables. The first shows absolute throughput by DBMS tested X benchmark step. The second has throughput relative to the version from the first row of the table. The third shows the background insert rate for benchmark steps with background inserts and all systems sustained the target rates. The second table makes it easy to see how performance changes over time. The third table makes it easy to see which DBMS+configs failed to meet the SLA.

Below I use relative QPS to explain how performance changes. It is: (QPS for $me / QPS for $base) where $me is my version and $base is the version of the base case. When relative QPS is > 1.0 then performance improved over time. When it is < 1.0 then there are regressions. The Q in relative QPS measures: 
  • insert/s for l.i0, l.i1, l.i2
  • indexed rows/s for l.x
  • range queries/s for qr100, qr500, qr1000
  • point queries/s for qp100, qp500, qp1000
Below I use colors to highlight the relative QPS values with red for <= 0.95, green for >= 1.05 and grey for values between 0.95 and 1.05.

Results: InnoDB

The base case is MySQL 5.6.51 - my5651_rel.cz11a_bee or my5651_rel.cz11a_c8r32. 

It is compared with MySQL 5.7.44 and 8.0.37 (my5744_rel.cz11a_bee, my5744_rel.cz11a_c8r32, my8037_rel.cz11a_bee, my8037_rel.cz11a_c8r32).

tl;dr
  • There is a large regression from 5.6 to 5.7 and then again from 5.7 to 8.0
  • MySQL 8.0.37 gets ~30% less throughput relative to 5.6.51
From the summary for SER4 the relative throughput per benchmark step is:
  • l.i0
    • relative QPS is 0.84 in 5.7.44 with SER4
    • relative QPS is 0.57 in 8.0.37 with SER4
  • l.x - I ignore this for now
  • l.i1, l.i2
    • relative QPS is 1.150.87 in 5.7.44 with SER4
    • relative QPS is 1.020.71 in 8.0.37 with SER4
  • qr100, qr500, qr1000
    • relative QPS is 0.750.740.73 in 5.7.44 with SER4
    • relative QPS is 0.640.640.63 in 8.0.37 with SER4
  • qp100, qp500, qp1000
    • relative QPS is 0.810.820.83 in 5.7.44 with SER4
    • relative QPS is 0.610.610.63 in 8.0.37 with SER4
From the summary for PN53 the relative throughput per benchmark step is:
  • l.i0
    • relative QPS is 0.89 in 5.7.44 with PN53
    • relative QPS is 0.61 in 8.0.37 with PN53
  • l.x - I ignore this for now
  • l.i1, l.i2
    • relative QPS is 1.061.01 in 5.7.44 with PN53
    • relative QPS is 0.980.84 in 8.0.37 with PN53
  • qr100, qr500, qr1000
    • relative QPS is 0.830.850.83 in 5.7.44 with PN53
    • relative QPS is 0.750.760.74 in 8.0.37 with PN53
  • qp100, qp500, qp1000
    • relative QPS is 0.870.860.86 in 5.7.44 with PN53
    • relative QPS is 0.700.690.69 in 8.0.37 with PN53
Results: MyRocks

The base case is MyRocks 5.6.35:
  • fbmy5635_rel_240606_4f3a57a1.cza1_bee or fbmy5635_rel_240606_4f3a57a1.cza1_c8r32
The base case is compared with MyRocks 8.0.28 and 8.0.32 
  • fbmy8028_rel_240606_c6c83b18.cza1_bee, fbmy8028_rel_240606_c6c83b18.cza1_c8r32
  • fbmy8032_rel_240606_59f03d5a.cza1_bee, fbmy8032_rel_240606_59f03d5a.cza1_c8r32
tl;dr
  • These results have more variance than the InnoDB results above, especially for range queries. It might be that I need to run the qr* benchmark steps for more than 1800 seconds.
From the summary for SER4 the relative throughput per benchmark step is:
  • l.i0
    • relative QPS is 0.72 in 8.0.28 with SER4
    • relative QPS is 0.67 in 8.0.32 with SER4
  • l.x - I ignore this for now
  • l.i1, l.i2
    • relative QPS is 0.900.85 in 8.0.28 with SER4
    • relative QPS is 0.910.82 in 8.0.32 with SER4
  • qr100, qr500, qr1000
    • relative QPS is 0.73, 1.041.06 in 8.0.28 with SER4
    • relative QPS is 0.640.920.85 in 8.0.32 with SER4
  • qp100, qp500, qp1000
    • relative QPS is 0.970.950.92 in 8.0.28 with SER4
    • relative QPS is 0.870.880.88 in 8.0.32 with SER4
From the summary for PN53 the relative throughput per benchmark step is:
  • l.i0
    • relative QPS is 0.70 in 8.0.28 with PN53
    • relative QPS is 0.66 in 8.0.32 with PN53
  • l.x - I ignore this for now
  • l.i1, l.i2
    • relative QPS is 0.870.90 in 8.0.28 with PN53
    • relative QPS is 0.920.88 in 8.0.32 with PN53
  • qr100, qr500, qr1000
    • relative QPS is 1.401.120.91 in 8.0.28 with PN53
    • relative QPS is 0.811.000.83 in 8.0.32 with PN53
  • qp100, qp500, qp1000
    • relative QPS is 0.890.890.90 in 8.0.28 with PN53
    • relative QPS is 0.870.870.88 in 8.0.32 with PN53
Results: MyRocks vs InnoDB

The base case is MySQL 8.0.32 - my8032_rel.cz11a_bee or my8032_rel.cz11a_c8r32.

It is compared with MyRocks 8.0.32 - fbmy8032_rel_240606_59f03d5a.cza1_bee or fbmy8032_rel_240606_59f03d5a.cza1_c8r32.

tl;dr
  • For l.i0
    • CPU overhead (see cpupq for SER4 and for PN53) increases a lot from 5.6 to 8.0 for both InnoDB and MyRocks, and the regressions are probably from code above the storage engine
  • For l.i1 and l.i2
    • CPU overhead (see cpupq for SER4 and for PN53) increases from 5.6 to 8.0 for MyRocks while for InnoDB there is more variance but less of an increase. Thus, while MyRocks was faster on l.i1 it became slower on l.i2 -- perhaps from tombstones, compaction and other MVCC GC overheads). Another difference between l.i1 and l.i2 is that the fraction of query time spent in the optimizer relative is larger with l.i2 because less work is done per DELETE statement. But I am speculating here and need more time to debug it.
    • The charts with per-second rates for inserts and deletes show more variance for MyRocks (for SER4 and PN53) than for InnoDB (for SER4 and PN53). 
  • For qr100
    • On the SER4 server the CPU overhead increases by ~1.5X from 5.6 to 8.0 for both MyRocks and InnoDB. But in absolute terms the increase is ~3X larger for MyRocks. On PN53 the relative increase is ~1.3X for both but the absolute increase for MyRocks is ~2X larger than for InnoDB. I need flamegraphs to understand why. See the cpupq column for SER4 and for PN53
  • For qp100 
    • For InnoDB, MyRocks the relative increases in CPU overhead from 5.6 to 8.0 are 1.6X, 1.2X on SER4 and 1.5X, 1.2X on PN53. So InnoDB get more new CPU overheads than MyRocks. See cpupq for SER4 and for PN53.
From the summaries for SER4 and for PN53
  • l.i0
    • relative QPS is 0.95 in MyRocks 8.0.32 with SER4
    • relative QPS is 0.92 in MyRocks 8.0.32 with PN53
  • l.x - I ignore this for now
  • l.i1, l.i2
    • relative QPS is 1.180.79 in MyRocks 8.0.32 with SER4
    • relative QPS is 1.300.85 in MyRocks 8.0.32 with PN53
  • qr100, qr500, qr1000
    • relative QPS is 0.400.440.41 in MyRocks 8.0.32 with SER4
    • relative QPS is 0.360.400.43 in MyRocks 8.0.32 with PN53
  • qp100, qp500, qp1000
    • relative QPS is 0.830.850.83 in MyRocks 8.0.32 with SER4
    • relative QPS is 0.820.820.82 in MyRocks 8.0.32 with PN53


Tuesday, June 11, 2024

MyRocks and InnoDB vs sysbench on a small server

This has results from the sysbench benchmark for many versions of MyRocks and MySQL (InnoDB)  on a small server with a cached database and low-concurrency workload.

The goal here is to document performance regressions over time for both upstream MySQL with InnoDB and FB MyRocks. If they get slower at a similar rate from MySQL 5.6 to 8.0 then the culprit is code above the storage engine. Otherwise, the regressions are from the storage engine.

My standard disclaimer is that sysbench with low-concurrency is great for spotting CPU regressions. However, a result with higher concurrency from a larger server is also needed to understand things. Results from IO-bound workloads and less synthetic workloads are also needed. But low-concurrency, cached sysbench is a great place to start.

tl;dr

  • InnoDB faster than MyRocks on almost all of the microbenchmarks because these tests are CPU-bound and MyRocks uses more CPU
  • Regressions from MySQL 5.6 to 8.0 are larger for InnoDB than for MyRocks.
  • InnoDB in MySQL 8.0.37 gets from 30% to 45% less QPS than in 5.6.51 depending on the test
  • For both InnoDB and MyRocks the largest regressions occur on write microbenchmarks

Builds and configuration

All DBMS were compiled from source.

I tested InnoDB from upstream MySQL 5.6.51, 5.7.44, 8.0.28, 8.0.32, 8.0.36 and 8.0.37. 

I tested MyRocks from FB MySQL 5.6.35, 8.0.28 and 8.0.32.
The my.cnf files are here for the SER4 and the PN53 servers.

Benchmarks

I used sysbench and my usage is explained here. There are 42 microbenchmarks and most test only 1 type of SQL statement.

Tests were run on two of my small servers. The first is a Beelink SER4 with 8 cores and 16G of RAM. The second is an ASUS PN53 with 8 cores and 32G of RAM. Both use XFS with 1 NVMe SSD and Ubuntu 22.04. The servers are described here.

The benchmark is run with 1 user, 1 table and 30M rows. In all cases
  • each microbenchmark runs for 300 seconds if read-only and 600 seconds otherwise
  • prepared statements were enabled
The command line for my helper scripts was:

bash r.sh 1 30000000 300 600 nvme0n1 1 1 1

Results

For the results below I split the 42 microbenchmarks into 5 groups -- 2 for point queries, 2 for range queries, 1 for writes. For the range query microbenchmarks, part 1 has queries that don't do aggregation while part 2 has queries that do aggregation. The spreadsheet with all data and charts is here. For each group I present a chart and a table with summary statistics.

All of the charts have relative throughput on the y-axis where that is (QPS for $me) / (QPS for $base), $me is some DBMS version (for example Postgres 16.3) and $base is either MySQL 5.6.35 with MyRocks or 5.6.51 with InnoDB. The y-axis doesn't start at 0 to improve readability. When the relative throughput is > 1 then that version is faster than the base case.

The legend under the x-axis truncates the names I use for the microbenchmarks and I don't know how to fix that other than sharing links (see above) to the Google Sheets I used.

Each section has two charts per microbenchmark group -- one for SER4, one for PN53.

Results: MyRocks

This section has results for MyRocks. The base case is the result from MyRocks in MySQL 5.6.35.

For MyRocks
  • there is a significant regression from 5.6 to 8.0. The QPS drops by 10% to 20% in 8.0.32. Writes have the worst regression
  • there are small improvements from 8.0.28 to 8.0.32
Summary statistics for MyRocks 8.0.32 relative to 5.6.35. The numbers are relative throughput: (QPS for 8.0.32 / QPS for 5.6.35).

SER4

minmaxavgmedian
point, part 10.760.960.870.89
point, part 20.870.900.890.90
range, part 10.680.930.810.81
range, part 20.810.940.870.85
writes0.610.850.770.78

PN53

minmaxavgmedian
point, part 10.800.970.900.91
point, part 20.900.940.930.94
range, part 10.650.940.840.82
range, part 20.870.960.910.90
writes0.660.890.820.82

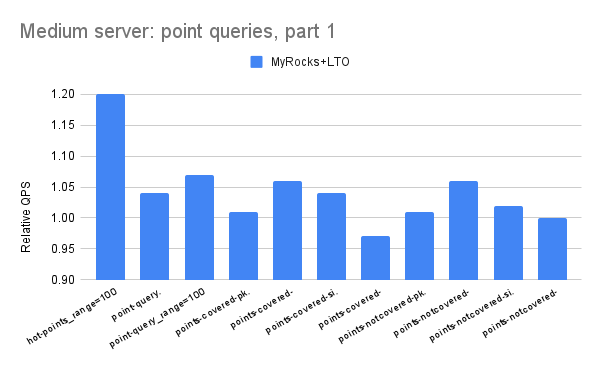
Point queries, part 1
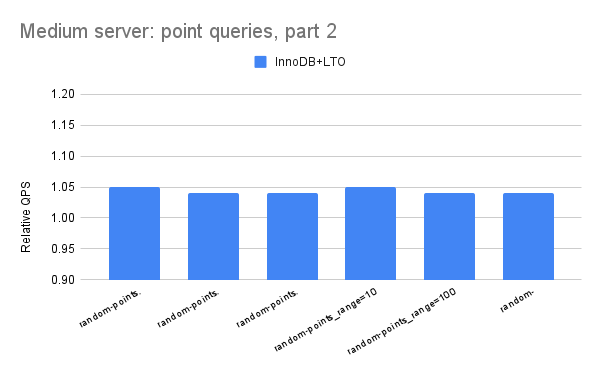
Point queries, part 2. The big improvements here are from a bug fix above the storage engine level.
Range queries, part 1

Range queries, part 2
Writes

Results: InnoDB

This section has results for InnoDB. The base case is the result from InnoDB in MySQL 5.6.51.

For InnoDB
  • there is a large regression from 5.6 to 5.7 and then again from 5.7 to 8.0
  • there largest regression is for writes
  • the regressions here are larger than the ones above for MyRocks. So some of the regressions here are specific to InnoDB and not from code above the storage engine
Summary statistics for InnoDB in MySQL 8.0.37 relative to InnoDB in MySQL 5.6.51. The numbers are relative throughput: (QPS for 8.0.37 / QPS for 5.6.51).

SER4

minmaxavgmedian
point, part 10.670.780.720.71
point, part 20.610.820.710.70
range, part 10.640.720.670.66
range, part 20.671.020.820.77
writes0.440.990.600.55

PN53

minmaxavgmedian
point, part 10.660.800.730.73
point, part 20.710.860.770.73
range, part 10.650.740.690.69
range, part 20.761.020.870.83
writes0.540.860.670.65

Point queries, part 1
Point queries, part 2
Range queries, part 1
Range queries, part 2
Writes
Results: InnoDB and MyRocks

This section includes results for InnoDB and MyRocks on the same graph. The base case is the result from InnoDB in MySQL 5.6.51. I don't include the summary statistics here because they were listed above.

InnoDB is a lot faster than MyRocks on almost all of the microbenchmarks because these tests are CPU-bound and MyRocks uses more CPU.

Point queries, part 1
Point queries, part 2
Range queries, part 1
Range queries, part 2
Writes

The bars for the update-index microbenchmark with MyRocks are truncated because MyRocks is a lot faster, but I want the chart to be readable. MyRocks is faster there thanks to read-free secondary index maintenance.