This has results from the sysbench benchmark for many versions of MyRocks and MySQL (InnoDB) on a small server with a cached database and low-concurrency workload.
The goal here is to document performance regressions over time for both upstream MySQL with InnoDB and FB MyRocks. If they get slower at a similar rate from MySQL 5.6 to 8.0 then the culprit is code above the storage engine. Otherwise, the regressions are from the storage engine.
My standard disclaimer is that sysbench with low-concurrency is great for spotting CPU regressions. However, a result with higher concurrency from a larger server is also needed to understand things. Results from IO-bound workloads and less synthetic workloads are also needed. But low-concurrency, cached sysbench is a great place to start.
tl;dr
- InnoDB faster than MyRocks on almost all of the microbenchmarks because these tests are CPU-bound and MyRocks uses more CPU
- Regressions from MySQL 5.6 to 8.0 are larger for InnoDB than for MyRocks.
- InnoDB in MySQL 8.0.37 gets from 30% to 45% less QPS than in 5.6.51 depending on the test
- For both InnoDB and MyRocks the largest regressions occur on write microbenchmarks
Builds and configuration
All DBMS were compiled from source.
I tested InnoDB from upstream MySQL 5.6.51, 5.7.44, 8.0.28, 8.0.32, 8.0.36 and 8.0.37.
I tested MyRocks from FB MySQL 5.6.35, 8.0.28 and 8.0.32.
The my.cnf files are here for
the SER4 and
the PN53 servers.
Benchmarks
I used sysbench and my usage is
explained here. There are 42 microbenchmarks and most test only 1 type of SQL statement.
Tests were run on two of my small servers. The first is a Beelink SER4 with 8 cores and 16G of RAM. The second is an ASUS PN53 with 8 cores and 32G of RAM. Both use XFS with 1 NVMe SSD and Ubuntu 22.04. The servers are
described here.
The benchmark is run with 1 user, 1 table and 30M rows. In all cases
- each microbenchmark runs for 300 seconds if read-only and 600 seconds otherwise
- prepared statements were enabled
The command line for my helper scripts was:
bash r.sh 1 30000000 300 600 nvme0n1 1 1 1
Results
For the results below I split the 42 microbenchmarks into 5 groups -- 2 for point queries, 2 for range queries, 1 for writes. For the range query microbenchmarks, part 1 has queries that don't do aggregation while part 2 has queries that do aggregation. The spreadsheet with all data and charts
is here. For each group I present a chart and a table with summary statistics.
All of the charts have relative throughput on the y-axis where that is (QPS for $me) / (QPS for $base), $me is some DBMS version (for example Postgres 16.3) and $base is either MySQL 5.6.35 with MyRocks or 5.6.51 with InnoDB. The y-axis doesn't start at 0 to improve readability. When the relative throughput is > 1 then that version is faster than the base case.
The legend under the x-axis truncates the names I use for the microbenchmarks and I don't know how to fix that other than sharing links (see above) to the Google Sheets I used.
Each section has two charts per microbenchmark group -- one for SER4, one for PN53.
Results: MyRocks
This section has results for MyRocks. The base case is the result from MyRocks in MySQL 5.6.35.
For MyRocks
- there is a significant regression from 5.6 to 8.0. The QPS drops by 10% to 20% in 8.0.32. Writes have the worst regression
- there are small improvements from 8.0.28 to 8.0.32
Summary statistics for MyRocks 8.0.32 relative to 5.6.35. The numbers are relative throughput: (QPS for 8.0.32 / QPS for 5.6.35).
SER4
| min | max | avg | median |
| point, part 1 | 0.76 | 0.96 | 0.87 | 0.89 |
| point, part 2 | 0.87 | 0.90 | 0.89 | 0.90 |
| range, part 1 | 0.68 | 0.93 | 0.81 | 0.81 |
| range, part 2 | 0.81 | 0.94 | 0.87 | 0.85 |
| writes | 0.61 | 0.85 | 0.77 | 0.78 |
PN53
| min | max | avg | median |
| point, part 1 | 0.80 | 0.97 | 0.90 | 0.91 |
| point, part 2 | 0.90 | 0.94 | 0.93 | 0.94 |
| range, part 1 | 0.65 | 0.94 | 0.84 | 0.82 |
| range, part 2 | 0.87 | 0.96 | 0.91 | 0.90 |
| writes | 0.66 | 0.89 | 0.82 | 0.82 |
Point queries, part 1
Point queries, part 2. The big improvements here are from a bug fix above the storage engine level.
Range queries, part 1
Range queries, part 2
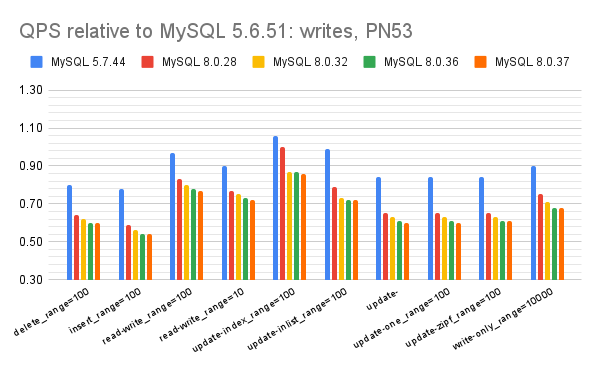
Writes
Results: InnoDB
This section has results for InnoDB. The base case is the result from InnoDB in MySQL 5.6.51.
For InnoDB
- there is a large regression from 5.6 to 5.7 and then again from 5.7 to 8.0
- there largest regression is for writes
- the regressions here are larger than the ones above for MyRocks. So some of the regressions here are specific to InnoDB and not from code above the storage engine
Summary statistics for InnoDB in MySQL 8.0.37 relative to InnoDB in MySQL 5.6.51. The numbers are relative throughput: (QPS for 8.0.37 / QPS for 5.6.51).
SER4
| min | max | avg | median |
| point, part 1 | 0.67 | 0.78 | 0.72 | 0.71 |
| point, part 2 | 0.61 | 0.82 | 0.71 | 0.70 |
| range, part 1 | 0.64 | 0.72 | 0.67 | 0.66 |
| range, part 2 | 0.67 | 1.02 | 0.82 | 0.77 |
| writes | 0.44 | 0.99 | 0.60 | 0.55 |
PN53
| min | max | avg | median |
| point, part 1 | 0.66 | 0.80 | 0.73 | 0.73 |
| point, part 2 | 0.71 | 0.86 | 0.77 | 0.73 |
| range, part 1 | 0.65 | 0.74 | 0.69 | 0.69 |
| range, part 2 | 0.76 | 1.02 | 0.87 | 0.83 |
| writes | 0.54 | 0.86 | 0.67 | 0.65 |
Point queries, part 1

Results: InnoDB and MyRocks
This section includes results for InnoDB and MyRocks on the same graph. The base case is the result from InnoDB in MySQL 5.6.51. I don't include the summary statistics here because they were listed above.
InnoDB is a lot faster than MyRocks on almost all of the microbenchmarks because these tests are CPU-bound and MyRocks uses more CPU.
Point queries, part 1
Point queries, part 2
Range queries, part 1
Range queries, part 2
Writes
The bars for the update-index microbenchmark with MyRocks are truncated because MyRocks is a lot faster, but I want the chart to be readable. MyRocks is faster there thanks to read-free secondary index maintenance.


No comments:
Post a Comment