Monday, October 31, 2022

s/optimal/better/g - on reviewing conference papers

I spent a few years reviewing papers for database conferences. I think that is winding down. I was OK as a reviewer, definitely not great, and this summarizes my experience.

For starters, I am in awe of good reviwers. As a reviewer you get to see feedback from the other reviwers after submitting your review. And I was always nervous while waiting to see the other reviews. Was my review an outlier? How much did I miss in my review? Reading good reviews after submitting a mediocre review is a great way to learn.

As always, a key to success is to choose the right base case especially if you want to show linear speedup or scaleup. Many of the papers use the DBMS that I know quite well (MySQL, RocksDB) as the base case. So I have frequent someone on the internet is wrong moments while reading such papers. My offer to provide (free) benchmark advice to research projects was ignored. But maybe that is OK, because I am already busy.

My goal was to focus on the ideas in the paper and allow that the experimental results might be truthy rather than true. There are many interesting ideas in conference papers even if the experimental results aren't perfect. The review process was better for me after I learned to appreciate the ideas and worry less about flaws in the benchmarks.

I prefer to read a paper that explains where the new idea both is and is not better, but perhaps the marketing pressure and page limit means that papers don't focus much on where the new idea isn't better. I also prefer to have an explanation of the results -- I have had to retract a few DBMS perf blog posts because I didn't explain the results and they turned out to be misleading or bogus. Alas, papers rarely explained the (disappointing) results of the base case when showing they were so much faster than the base case.

Frequent feedback I had for papers:

  • s/optimal/better/g because optimal has a high bar. Papers would show their thing improved performance in some cases but better might not be optimal. Some math would be needed for that.
  • Provide more details to make reproduction possible. I am not offering to spend the time to do a repro nor am I suggesting that others should spend their time on that. But I want to know basic things about the base case (the thing that your thing is better than) including version tested, configuration details and command lines.
A short rant on the innovation bar
  • By innovation bar I mean the requirement that a paper shows how the idea is new relative to previously published peer-reviewed research. For some research track papers that I have reviewed I feel like the bar is raised too high, but that isn't my rant. My rant is that I have seen at least one industrial track paper rejected for not being innovative and my reading of the guidelines for industrial track papers in VLDB and SIGMOD is that there isn't an innovation bar for industry papers.
Bogus feedback that I avoided giving:
  • This idea has been implemented by DBMS or documented in some blog post. Conferences place a lot of value on innovation but fortunately the scope for prior art is limited to peer reviewed publications, not random blogs like this one. And researchers should not be expected to know all of the implementation details for amazing but not always well documented open and closed source DBMS. By bogus I mean that this doesn't count against the innovation bar -- research-track papers must show that something is innovative in their work. When said idea has previously been published then the reviewed paper must show how it differs.  But the paper isn't required to show how it differs from an idea described in a blog post or implemented in a production DBMS. Sometimes I gave feedback with a strong disclaimer when ideas have previously appeared in blog posts or an existing DBMS. And by strong disclaimer I mean that I made it clear that I would not and could not hold this against the paper.
Feedback that I was extremely reluctant to provide:
  1. Run X more tests. I am happy to require that before software is deployed in production. I am wary of asking for much more unless the experiment section is sad.
Updates:
  • Clarified what I mean by bogus feedback
  • Added rant on innovation bar

Wednesday, October 26, 2022

Quantifying storage on Linux

Some things are complicated but I understand them (RocksDB). Clearly that isn't too complicated and the complexity might be a barrier to entry which boosts the demand for my skills. Other things are complicated and I don't understand them that well. Clearly those things are too complicated.

Yes, I am trying to be funny but what I wrote above might be true for many of us. In this case the thing that I don't understand that well are things that support IO for a DBMS -- filesystems, block layer and storage devices. It is likely that something in this post is factually incorrect and I am happy to be corrected. Some of my posts are thinly veiled attempts to get free advice from experts.

The problem I am trying to understand this week is the size of IO requests at different layers of the stack while running RocksDB benchmarks. To be specific: are the reads being done at a multiple of 512 or 4096 bytes? And when might that be possible (O_DIRECT vs buffered IO). From the details below I suspect I can do 512-byte reads with O_DIRECT on the v3.small and v4.small servers, but a 512-byte read on the GCP server will end up doing a 4096-byte transfer at some level of the stack.

I am trying to understand the cases when a read-only workload with RockDB can and cannot saturate the IO capacity of a storage device. I am using 3 types of servers: home servers that I will abbreviate as v3.small and v4.small, and a c2-standard-60 server in GCP that uses SSD Persistent Disk. In all cases the filesystem is XFS and the OS is Ubuntu 22.04. You need CPU to do IO and the number of CPU cores is 4 (Intel i7 @ 2.7GHz) for v3.small, 8 (AMD Ryzen 7 at 2GHz) for v4.small and 30 (Intel Xeon @ 3.1GHz) for c2-standard-60. The storage is NVMe from Samsung 970 EVO on v3.small and Kingston on v4.small. I don't know what device is used for GCP.

The rest of this post lists the information that I found via:

  • /sys/block/$device/queue/*
  • lsblk -t $dev
  • xfs_info

Details: lsblk

Note:

  • {v3,v4}.small use min-io=512, phy-sec=512, log-sec=512
  • GCP uses min-io=4096, phy-sec=4096, log-sec=512
  • From this I wonder whether there are cases where RocksDB can actually do 512-byte IO requests (logical) and whether all layers of the stack will respect that and not do 4096-byte requests to return the requested 512 bytes (physical). 
  • One guess that when LOG-SEC < PHY-SEC (see GCP below) that some layer of the stack will do an operation at the larger (PHY-SEC) size but return the smaller (LOG-SEC) size.
From lsblk --help:
  • MIN-IO - minimum I/O size
  • PHY-SEC - physical sector size
  • LOG-SEC - logical sector size

And the full details on the storage that I use. The man page for lsblk is here.

# v3.small
$ lsblk -t /dev/nvme0n1
NAME    ALIGNMENT MIN-IO OPT-IO PHY-SEC LOG-SEC ROTA SCHED RQ-SIZE  RA WSAME
nvme0n1         0    512      0     512     512    0 none     1023 128    0B

# v4.small
$ lsblk -t /dev/nvme0n1
NAME    ALIGNMENT MIN-IO OPT-IO PHY-SEC LOG-SEC ROTA SCHED RQ-SIZE  RA WSAME
nvme0n1         0    512      0     512     512    0 none      255 128    0B

# GCP
$ lsblk -t /dev/sdb
NAME ALIGNMENT MIN-IO OPT-IO PHY-SEC LOG-SEC ROTA SCHED RQ-SIZE  RA WSAME
sdb          0   4096      0    4096     512    0 none     8192 128    4G

Details: /sys

Docs for these are here and several of these values are also in lsblk output above.

From /sys/block/$device/queue/$name
v3      v4      GCP     name
512     512     4096    physical_block_size
512     512     512     logical_block_size
512     512     512     hw_sector_size
512     512     4096    minimum_io_size
512     512     4096    physical_block_size
none    none    none    scheduler
512     512     4096    discard_granularity
1280    256     256     max_sectors_kb
nvme0n1 nvme0n1 sdb     $device

Details: xfs_info

The man page for xfs_info is here. The filesystems were created using default option for mkfs.xfs.


# v3.small

$ xfs_info /dev/nvme0n1

meta-data=/dev/nvme0n1           isize=512    agcount=4, agsize=30524162 blks

         =                       sectsz=512   attr=2, projid32bit=1

         =                       crc=1        finobt=1, sparse=1, rmapbt=0

         =                       reflink=1    bigtime=0 inobtcount=0

data     =                       bsize=4096   blocks=122096646, imaxpct=25

         =                       sunit=0      swidth=0 blks

naming   =version 2              bsize=4096   ascii-ci=0, ftype=1

log      =internal log           bsize=4096   blocks=59617, version=2

         =                       sectsz=512   sunit=0 blks, lazy-count=1

realtime =none                   extsz=4096   blocks=0, rtextents=0


# v4.small

$ xfs_info /dev/nvme0n1

meta-data=/dev/nvme0n1           isize=512    agcount=4, agsize=30524162 blks

         =                       sectsz=512   attr=2, projid32bit=1

         =                       crc=1        finobt=1, sparse=1, rmapbt=0

         =                       reflink=1    bigtime=0 inobtcount=0

data     =                       bsize=4096   blocks=122096646, imaxpct=25

         =                       sunit=0      swidth=0 blks

naming   =version 2              bsize=4096   ascii-ci=0, ftype=1

log      =internal log           bsize=4096   blocks=59617, version=2

         =                       sectsz=512   sunit=0 blks, lazy-count=1

realtime =none                   extsz=4096   blocks=0, rtextents=0


# GCP

$ xfs_info /dev/sdb

meta-data=/dev/sdb               isize=512    agcount=4, agsize=196608000 blks

         =                       sectsz=4096  attr=2, projid32bit=1

         =                       crc=1        finobt=1, sparse=1, rmapbt=0

         =                       reflink=1    bigtime=0 inobtcount=0

data     =                       bsize=4096   blocks=786432000, imaxpct=5

         =                       sunit=0      swidth=0 blks

naming   =version 2              bsize=4096   ascii-ci=0, ftype=1

log      =internal log           bsize=4096   blocks=384000, version=2

         =                       sectsz=4096  sunit=1 blks, lazy-count=1

realtime =none                   extsz=4096   blocks=0, rtextents=0

Monday, October 24, 2022

Small servers for performance testing, v4

I am setting up my fourth cluster of small servers to test open source database software. Cluster might be an overstatement because each cluster is limited to 2 or 3 servers. The clusters were/are:

  • v1 - Intel NUC5i3ryh (5th gen core i3), 8G RAM, SATA disk for OS, Samsun 850 EVO m.2 for db
  • v2 - Intel NUC7i5bnh (7th gen core i5), 16G RAM, Samsung 850 EVO SATA for OS, Samsung 960 EVO m.2 for db
  • v3 - Intel NUC8i7beh (8th gen core i7), 16G RAM, Samsung 860 EVO SATA for OS, Samsung 970 EVO m.2 for db
  • v4 - Beelink SER 4700u with Ryzen 7 4700u, 16G RAM, WD Blue 1T SATA for OS, Kingston NVMe for db
  • v5 - Beelink SER7 7840HS with Ryzen 7 7840HS, 32G RAM, 1T m.2 SSD for OS, 2T Samsung Pro 990 for the database. This is also my first mini PC with a fan and TDP is 65w which is a bit larger than what came before. Passmark single-thread rating is 3771 vs 2532 for the v4 server.
  • v6 - SuperMicro SuperWorkstation 7049A-T with 2 sockets, 12 cores/socket, 64G RAM, one m.2 SSD (2TB, XFS). CPU is Intel Xeon Silver 4214R CPU @ 2.40GHz
  • v7 - Dell Precision 7865 Tower Workstation with 1 socket, 128G RAM, AMD Ryzen Threadripper PRO 5975WX 32-Cores, 2 m.2 SSD (each 2TB, RAID SW 0, XFS)
More details on previous clusters are here for v1 and v2 and then for v3. I use a separate disk for the OS because I expect the database SSD to wear out and I don't want to reinstall the OS when that happens. Posts on monitoring for endurance are here and here but in the past I have neglected to catch that early enough and some SSDs greatly exceeded their endurance ratings.

The CPUs for each cluster:

  • v1 - Intel i3-5010U with 2 cores. I think I left hyperthread enabled to get 4 HW threads.
  • v2 - Intel i5-7260U with 2 cores. Again, I think I left hyperthread enabled to get 4 HW threads. But this was about 2X faster on the compile MySQL 8.1 benchmark. Turbo boost was also disabled to reduce performance variance.
  • v3 - Intel i7-8559U with 4 cores and hyperthread disabled. Turbo boost was also disabled to reduce performance variance so the CPU runs at 2.70 GHz.
  • v4 - AMD Ryzen 7 4700u with 8 cores and 8 HW threads. Turbo core was disabled to reduce performance variance. I am still figuring out what the base clock speed is.
  • v5 - AMZ Ryzen 7 7840HS with 8 cores and 16 HW threads. Turbo core was disabled to reduce performance variance.
The Beelink (v4) server comes with 16G of RAM and 512G of NVMe m.2 installed. Then I installed a 1T SATA SSD. So putting the HW together was a bit easier with Beelink than with the NUC as the NUC kits I ordered required me to install RAM, m.2 and SATA SSDs.

The SER 4700u web page claims that Crucial DDR4 DRAM and Kingston NVMe m.2 are used. I confirmed that Kingston was provided. I was happy to learn this comes with quality components, and again the price is great. (Update) After wearing out one of the Kingston SSDs I replaced them with Samsung 980 Pro (1TB) which is a lot faster.

Why AMD?

I have been happy with my Intel NUC clusters but I chose AMD this time because the prices and reviews for Beelink were great and because I am not the target use case for the new Intel NUCs. The Intel NUC is currently on the 12th generation. I had to go back to the 10th gen to find a NUC that would work for me. The newer ones were either targeted at gaming, home video or had a mix of performance and efficiency cores. More than anything, I need consistent performance and can't make use of both performance and efficiency cores.

The NUCs were reliable for me. Their only weak spot was the wires attached to the base that would have to flex when you remove the base to replace SSDs and the wires on 1 server eventually failed at the flex point. I shipped them back to Intel and received a new one. The Beelink server only has one ribbon for SATA connected to the base and it is much more flexible.

All of the cluster servers claim a low TDP. I like that as I don't want to trip circuit breakers or have them heat the server room. I also want to be able to use them, at least at night, in the summer when it starts to get warm. While the CPU performance is likely to have not that much variance given that I disabled turbo, I still wonder about SSD performance variance due to heat.

Setup

Setting up the Beelink was easy -- remove 4 screws on the bottom, insert a small allen wrench into a gap to pry the base off (the hardest part) and then add the SATA SSD. In the BIOS (hold "delete" on boot) I changed the boot order to move SATA before NVMe. I am not sure if I needed to reorder the USB when I used that to install Linux. 

The server comes with some flavor of Windows on the m.2 SSD and will boot into the Windows setup if you are not careful. This was confusing because the first few screens of that process don't make it clear that you are about to setup Windows. Reboot and hold f7 to quickly get to a screen where you can change the boot order.

One small feature that is extra useful is that the Beelink server lists the BIOS prompt keys on the bottom plate -- delete to get the full BIOS and f7 to get the boot order screen. I wish the NUC had that as I always relearn it by experimenting. I think it is f2. While the Intel NUC BIOS was easier to navigate it is also a visual BIOS so I get a bit more exercise finding a mouse whenever I have to fiddle with it, and I recently had to disable secure boot on the NUCs to make blktrace work.

I installed Ubuntu 22.04 Server via a thumb drive. This was easy. Soon after the install I removed cloud-init as that slows the boot process and adds a bit too much text during boot. I was able to get a wifi connection during installed, but after install the wifi setup step would hang during boot. I am still not sure why that happened -- my unproven but educated guesses were: wifi worked better when the boxes weren't next to each other, wifi worked better when the boxes connected to my wifi base router rather than a wifi extender.

While I can disable turbo boost in the BIOS on the Intel NUCs, with AMD there was no BIOS option to disable turbo core. But there are things that can be done after boot. This is fine for me given that I already run scripts at startup to enable the usage of gdb and mount my database filesystem. The scripts do the following. The last line disabled turbo core.

echo -1 > /proc/sys/kernel/perf_event_paranoid
echo 0 > /proc/sys/kernel/yama/ptrace_scope
sudo sh -c " echo 0 > /proc/sys/kernel/kptr_restrict"
echo 1 > /proc/sys/kernel/sysrq
echo x > /proc/sysrq-trigger
mount -o noatime,nodiratime,discard,noauto /dev/nvme0n1 /data
echo '0' > /sys/devices/system/cpu/cpufreq/boost

Debugging

From the output of cpupower frequency-info and turbostat I think the base clock is 2GHz. But I am not certain yet. Modern CPUs are complicated. Example output is here. I haven't used these tools and this post was useful both for the tools and as an introduction into how clock frequency can change (C states and more).

I needed to debug a performance difference -- the per-cpu IOPs from fio was ~20k on one server vs ~45k on the other. I ran perf top and the difference was obvious, read_hpet.0 was 50% of the CPU on the slow server and not visible on the fast server. Also the ratio of user to system CPU time was very different between the servers. 

This line in dmesg output was a strong hint:
TSC found unstable after boot, most likely due to broken BIOS. Use 'tsc=unstable'

More details are here and eventually I found this Reddit post. The fix is below. I don't have an opinion on whether this is a HW issue or whether Linux will become more tolerant when measuring TSC at startup while choosing a clock source. Regardless, it is confusing to debug.
  1. edit /etc/default/grub -> GRUB_CMDLINE_LINUX_DEFAULT="clocksource=tsc tsc=reliable"
  2. update-grub
  3. reboot
Bad SSD

Both servers are getting READ FPDMA QUEUED and WRITE FPDMA QUEUED errors from the SATA SSD (WD Blue SA510). I will guess that the problem is the WD Blue SSD and will soon replace it with a Samsung 870. The errors in dmesg look like this. The error has yet to repro after the replacement, but I also used screws to lock down the drive during the replacement and they were not used prior. So perhaps the lack of screws was the problem.

Worn out SSD

The Kingston SSD shipped with the boxes quickly reached the endurance limit. It has been replaced with 1TB Samsung 980 Pro.

Disappearing SSD

While the Samsung 980 Pro endurance has been great, one of the devices reached EoL too soon. The endurance consumed is likely less than 10% but the device disappeared. Time to buy a replacement. Details are here.

systemd

The default behavior for systemd is to remove your files from /dev/shm when you logout, even if a screen session is still running as you -- see here. This removes files that Postgres needs. To avoid that:
  1. add RemoveIPC=no to /etc/systemd/logind.conf
  2. sudo systemctl restart systemd-logind.service
netplan

I always forget these:
sudo vi /etc/netplan/00-installer-config-wifi.yaml
  sudo netplan apply

Problems with the v4 server

I get XFS errors and the device either goes into read-only mode or disappears (see here for details). So I am working on monitoring temperatures on the device and the SSD temp is easy to get but the sensors command provided by the lm_sensors package doesn't find any CPU temp when using Ubuntu 22.04 with the 5.15 kernel. So I upgraded to the HWE kernels to get a 6.2 kernel which is able to read CPU temps. To upgrade the kernel I used: sudo apt install linux-generic-hwe-22.04. I can monitor the NVMe devices via one of:
sudo smartctl -a /dev/nvme0n1
sudo nvme smart-log /dev/nvme0n1
The XFS errors occur for the Samsung 990 Pro device I added but smartctl shows that the error log is empty and the temp never entered the warning range (see here). That devices stores the benchmark database and is very busy. For the NVMe device that has the OS install and only gets benchmark output (not very busy) there are logged errors and the device enters the warning temp range (see here). The logged error message is here. Info from fwupdmgr on the two NVMe devices is here. The BIOS is set to Balanced rather than Performance which means the TDP is lower.

I have been disabling turbo on the CPU via this command. After my current attempt to repro the problem I will try another round without this:
echo '0' > /sys/devices/system/cpu/cpufreq/boost
Next up is repeating the benchmarks with scripts running in the background to monitor temperatures.

Problems with the v5 server: part 1

The v4 Beelink has a Mediatek wifi chip that uses the mt7921e driver. The v5 Beelink uses the Intel AX200 wifi chip and there are problems -- the driver frequently crashes and restarts (see here). There was also a corruption problem with XFS (see here) but that occurred after many wifi crashes so I am now running with wifi disabled to see if the XFS error repeats. 

Possibly related error reports for the wifi problem:
Problems with the v5 server: part 2

The command to get the BIOS info while running is:  sudo dmidecode -t bios

The v5 server I purchased in 2023 has the BIOS version SER7PRO_P5C8V28. The two that I purchased in March 2024 have SER7PRO_P5C8V38. I will call these the v28 and v38 versions. With the v38 version I get many errors (see dmesg output or syslog) about correctable PCI errors when I put a m.2 device in the second m.2 slot (the one above the fan). These errors occurred with devices that support Gen4 PCI (Samsung 980 Pro, Crucial T500) and Gen3 (Samsung 970 EVO). While the device probably work I worry about the performance implications and I also don't want so much log spam.

Much more info on this is here.

Based on searching the web, one thing that might work is to disable Active State Power Management (ASPM), and if nothing else, disabling ASPM makes the error messages stop. Notes on that are in this thread and the GRUB kernel options I use for the v5 server are set in /etc/default/grub:

GRUB_CMDLINE_LINUX_DEFAULT="pcie_aspm=off nosmt amd_pstate=disable"

  • pcie_aspm=off is there to avoid correctable PCI errors (maybe Beelink BIOS needs an update)
  • nosmt disables hyperthreads because BIOS doesn't have an option for that
  • amd_pstate=disable lets me use the acpi-cpufreq driver
BIOS info from the 2023 purchase:

$ sudo dmidecode -t bios
# dmidecode 3.3
Getting SMBIOS data from sysfs.
SMBIOS 3.5.0 present.

Handle 0x0000, DMI type 0, 26 bytes
BIOS Information
Vendor: American Megatrends International, LLC.
Version: SER7PRO_P5C8V28
Release Date: 08/14/2023
Address: 0xF0000
Runtime Size: 64 kB
ROM Size: 32 MB
Characteristics:
PCI is supported
BIOS is upgradeable
BIOS shadowing is allowed
Boot from CD is supported
Selectable boot is supported
BIOS ROM is socketed
EDD is supported
ACPI is supported
BIOS boot specification is supported
Targeted content distribution is supported
UEFI is supported
BIOS Revision: 5.29

Handle 0x002B, DMI type 13, 22 bytes
BIOS Language Information
Language Description Format: Long
Installable Languages: 1
en|US|iso8859-1
Currently Installed Language: en|US|iso8859-1

Early lock release and InnoDB

Early lock release has been in the news and I almost forgot that we prototyped this for InnoDB while figuring out how to do group commit for both the InnoDB redo log and MySQL replication log. A Facebook Note about that work is here, but formatting isn't great as Notes for Pages have been deprecated.

Had the feature made it into a release it would have been documented, because it isn't good to surprise users with a feature that can make visible commits disappear after the primary DBMS crashes and recovers. It is even worse when the race is as simple as the DBMS process doing crash/recover which is more common than the primary node's HW doing the same. In the former there is no protection, in the latter enabling fsync on commit prevents it.

Early lock release also made it into MariaDB and Percona via XtraDB. Again, that was documented.

Since I don't want to lose the content for the note I have republished it below. Several of the links no long work.

Content

Group commit has an interesting history in MySQL. Peter opened bug 13669 for this many years ago. That bug has been closed and InnoDB announced that the plugin uses group commit. That is only true when the binlog is disabled. Things are more complicated when the binlog is enabled and I am not certain this is clear from the documentation.

There are three log writes during commit when the binlog is enabled. I have written about this before and am repeating myself to help the reader understand how group commit has been fixed in the Facebook patch. The log writes are:

How did InnoDB fix group commit in the 1.0.4 plugin? They changed either step 1 or step 3 to use group commit and that can make performance much better when the binlog is disabled. Alas, most of us run with the binlog enabled. It might not be enabled on a slave, but there is much less opportunity for group commit on a slave as the SQL thread is single-threaded. The peak number of commits per second on a server can be limited by the peak number of fsync calls per second that a disk system can perform.

Vamsi Ponnekanti and Ryan McElroy implemented group commit for the binlog write/fsync and this is now part of the Facebook patch for MySQL. Kristian Nielsen has begun working on a fix for this as part of MariaDB. Mats from the MySQL replication team has begun describing a fix for this as part of official MySQL. As MySQL is reluctant to commit to claiming things will be fixed in future releases, I won't claim that MySQL has work in progress. I will claim that I think this won't be a problem in the future and that bug 49326 will be fixed.

Three solutions have been described and it is possible that three different solutions will be implemented. I don't mind this diversity. At least one of these solutions will be excellent. Work done by my team has different constraints than work done for MariaDB or official MySQL. They can do the right thing even when that requires changing a lot of code and taking a lot of time. Others must solve problems faster.

Group commit in the Facebook patch

Vamsi provided a lot of the content that follows.

Group commit isn't possible today in official MySQL and MariaDB for the binlog write/flush/fsync because prepare_commit_mutex is locked for the duration of that work. The first change we made was to add a dynamic server configuration variable, innodb_prepare_commit_mutex, to disable use of that mutex. The mutex is only required when hot backup is being done and most of the time we are not taking a hot backup. The mutex is not used when innodb_prepare_commit_mutex=OFF so that threads can concurrently run the code that does the write/flush/fsync for the binlog.

The next step is to make sure that the binlog and InnoDB transaction log are written in the same order. This would otherwise be possible when prepare_commit_mutex is not used.  We use tickets to force the same order. A thread is assigned a ticket number when it prepares an InnoDB transaction by writing changes for that transaction to the InnoDB log. Threads write transaction changes to the binlog in ticket number order. After writing the changes to the binlog a thread will wait a small amount of time. During that wait another thread might do the binlog fsync thus saving this thread and possibly others from also doing an fsync. A server configuration variable, force_binlog_order, was added to determine whether this feature is enabled.

Unfortunately, all of the changes described thus far do not improve performance when there are concurrent threads trying to modify the same rows. The results below are from a sysbench read-write test with group commit enabled. TPS degrades at high-concurrency:

  16   32   64  128  256  384  512   #concurrent clients
 203  376  297  156   93   86   71   transactions per second

The problem is that the row locks are not released until the commit step is done (step 3 above). This means that the locks are not released until 2 fsyncs have been done (one for the InnoDB prepare step and one for the binlog write/flush/fsync step). We then added an server configuration variable, innodb_release_locks_early, to determine whether row locks are released during the prepare step. By doing this it is possible for other sessions to read changes that are not committed (if there is a crash after the InnoDB prepare step and before the binlog fsync, then that transaction will be rolled back during crash recovery). You should determine whether this is an issue.

The tests were repeated after the server included the change described above. Results are much better:

 16   32   64  128  256   512   #concurrent clients
203  376  297  156   93    71   transactions per second without change
               645   621  631   transactions per second with change

The final task was to make sure that this performs as expected for real workloads with lots of concurrency. Initial performance was disappointing. Vamsi discovered that there was too much mutex contention from the code that made the binlog write order match the InnoDB prepare order. The problem was that a single condition variable was used and broadcast was done to wake all threads waiting on it rather than the one thread that should next write the binlog. Vamsi fixed this by using an array of condition variables, making threads wait on (ticket# mod array_size), and then doing a broadcast only for one element of the array. This causes far fewer spurious wakeups.

If you want to read the source code for the changes then check out the change log for the Facebook patch for MySQL.

There are other changes as part of this feature:

Use caution while turning on group commit

As there are 3 variables controlling the feature, the order in which they are changed becomes important. This will be enabled and disabled dynamically as it should not be enabled when hot backups are done. If they are to be enabled dynamically, the suggested order when enabling group commit is:

Turning OFF innodb_prepare_commit_mutex before turning ON force_binlog_order could potentially cause some transactions to write to binlog in a different order than their commit order in transaction log.

The suggested order for dynamically disabling group commit is:

We added several tests for group commit:

[the content was cut off at this point]

Wednesday, October 19, 2022

Hyping the hyper clock cache in RocksDB

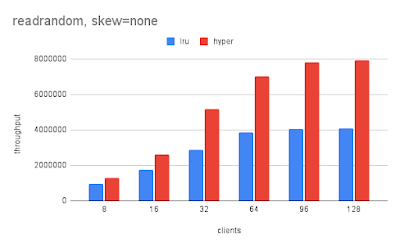
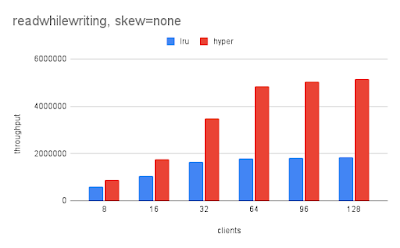
I previously tweeted about the performance improvements from the hyper clock cache for RocksDB. In this post I provide more info about my performance tests. This feature is new in RocksDB 7.7.3 and you can try it via db_bench --cache_type=hyper_clock_cache ....

The hyper clock cache feature implements the block cache for RocksDB and is expected to replace the the LRU cache. As you can guess from the name, the hyper clock cache implements a variant of CLOCK cache management. The LRU implementation is sharded with a mutex per shard. Even with many shards, I use 64, there will be hot shards and mutex contention. The hyper clock cache avoids those problems, but I won't try to explain it here because I am not an expert on it.

At the time of writing this, nobody has claimed to be running this feature in production and the 7.7.3 release is new. I am not throwing shade at the feature, but it is new code and new DBMS code takes time to prove itself in production.

Experiments

My first set of results are from a server with 2 sockets, 80 HW threads and 40 cores where hyperthreading was enabled. My second set of results are from a c2-standard-60 server in the Google cloud with 30 cores and hyperthreading disabled. The results from both are impressive.

For the server with 80 HW threads the benchmarks were repeated at 8, 16, 32, 64, 96 and 128 clients. For the c2-standard-60 server the benchmarks were repeated at 8, 24 and 48 clients. The goal was to run benchmarks for the CPU where it was: not saturated, saturated, oversubscribed. The database was cached by RocksDB in all cases.

I used a fork of benchmark.sh that is here and my fork repeats the test with 3 types of skew:

  • no skew - key accessed have a uniform distribution
  • 64.512 skew - point (range) queries only access the first 64 (512) key-value pairs
  • 8.64 skew - point (range) queries only access the first 8 (64) key-value pairs
This was a very simple way to generate skew. It wasn't the best way and had I started over would have used something more interesting. But I have results and will move on. One problem with this approach to generate skew is that the results for the *whilewriting benchmark variants are bogus (point queries with writes in the background, range queries with writes in the background) because all reads would hit in the memtable which is fast, but avoids accessing the block cache.

Graphs

Below I share graphs of throughput vs clients (number of threads) for four db_bench benchmarks:
  • readrandom - N clients do point queries
  • fwdrange - N clients do range queries. Each range query fetches 10 key-value pairs.
  • readwhilewriting - like readrandom, but has an extra client that does writes
  • fwdrangewhilewriting - like fwdrange, but has an extra client that does writes
In general, read-only benchmarks with an LSM can be misleading so I try to measure read performance with benchmarks that have some writes. But as I write above, the *whilewriting results are bogus for the 64.512 and 8.64 skew workloads. The client that does writes is rate limited.

In general, with the (old) LRU cache the throughput for point queries increases with more concurrency beyond the CPU not saturated configuration but in many cases throughput for range queries doesn't increase.

Graphs for the 80 HW thread server

The results are impressive even for the workloads without skew. 

Graphs for skew=none

Graphs for skew=64.512
Graphs for skew=8.64

Graphs for the c2-standard-60 server

Graphs for skew=none

Graphs for skew=64.512
Graphs for skew=8.64

Tuesday, October 18, 2022

Reasons for writeback with an update-in-place B-Tree

Are there well known names for the things that trigger dirty page writeback with an update-in-place B-Tree? Some of my performance discussions would be easier if I could point to those definitions.

I spent many years keeping InnoDB, an update-in-place B-Tree, happy in production and a shorter time with WiredTiger, a copy-on-write random (CoW-R) B-Tree. At work I recently revisited the topic of checkpoint and wondered if there were good names for the things that trigger page dirty page writeback. Alas, my InnoDB expertise isn't what it used to be.

InnoDB implements fuzzy checkpointing. While the reference manual page for this is too brief, the advice on that page is excellent -- a larger redo log is good because that reduces write-amplification. A short pitch for fuzzy checkpointing is that it avoids writeback storms, the kind that used to plague Postgres. When you ask a storage device to write GBs of data in a short amount of time there will be a queue and requests (reads, log fsync) that encounter that queue will wait. By redo log here I mean the sum of the sizes of the N redo logs you will use with InnoDB. The write-amp is reduced because LSN triggered writeback (using the terminology defined below) is reduced.

Back to my point about the things that trigger writeback. I will suggest names here. Hopefully I will learn that these have already been named and I can use the existing names. Otherwise I will try to use the names in the future. 

The triggers are:

  • shutdown - for InnoDB writeback is done on shutdown when innodb_fast_shutdown = 0 or 1. Writeback is not done when it is set to 2, but that means crash recovery is needed on startup. Back in the day when we did web-scale MySQL with spinning disks there were many slow shutdowns and at times the MySQL provided script that drove the shutdown would timeout (we modified that script to avoid timeouts).
  • LRU - writeback a dirty page when it reaches the end of the LRU but the memory can't be reused to store another block until the dirty page has been written back. This can occur when a user query needs to read a block into the buffer pool but all pages are in use (single-page writeback with InnoDB, bad for performance). But InnoDB also has a background thread that schedules writeback for dirty pages that are close to the LRU tail to avoid single-page writeback and the innodb_lru_scan_depth option controls how far from the tail it searches.
  • capacity - writeback dirty pages because the buffer pool has too many dirty pages. InnoDB has innodb_max_dirty_pages_pct to define too many. A limit is needed because it controls how long shutdown and crash recovery will take. With InnoDB these pages will be found from the end of the flush (dirty page) list but I want to distinguish this trigger from the previous one. Also with InnoDB this is triggered by one of the many tasks done by background threads.
  • LSN - writeback dirty pages for which the oldest commit is too old. For InnoDB too old means that the redo log that has changes for that commit will soon be recycled. There are many great resources for this topic written by others. With InnoDB this is triggered by a background thread.
Updates:
  • Laurynas Biveinis reminded me about innodb_lru_scan_depth. It is funny I forgot about that because long ago I had a production ready rewrite of it because the older code suffered from mutex contention. But before I could deploy it upstream had their own rewrite. I wasn't aware of their work-in-progress. But the new tests I wrote for my version found at least one bug in their rewrite, so it wasn't a complete waste of time.
  • While I write about update-in-place B-Tree above this is really about update-in-place and also includes heap-organized tables as used by Postgres, Oracle, etc
  • From Inaam, correction about usage of the flush list and names that I like for the writeback triggers: shutdown flushing, checkpoint flushing, dirty page flushing and LRU flushing
  • Much info from JFG about InnoDB internals related to writeback