I rely on rules of thumb when configuring a DBMS for a benchmark. This post is about configuring the number of background threads and the number of client threads for RocksDB to improve throughput and quality of service (low variance) with IO-bound workloads. The background threads are used for compaction and memtable flushes. The option is max_background_jobs.
Eventually I need to evaluate or re-evaluate whether these rules of thumb are valid and I am doing that here. One rule I use is that the number of busy threads should be less than or equal to the number of CPU cores (real cores, not HW threads courtesy of hyperthreading) and the reason for that rule is to reduce variance for workloads that are either CPU-bound or write-heavy (write-heavy implies much CPU from compaction). I frequently run benchmarks to look for performance regressions and variance makes that search harder. By busy threads I mean #client-threads + #background-threads where #client-threads is the number of client threads used by the benchmark client and #background-threads is the value for max_background_jobs.
For this blog post I compare the performance between two RocksDB configurations that are identical with one exception. One uses max_background_jobs=8 and the other uses =16.
The tl;dr context is an IO-bound workload (many storage reads and writes) on a server with fast storage and 80 HW threads (40 cores, hyperthreading enabled).
tl;dr
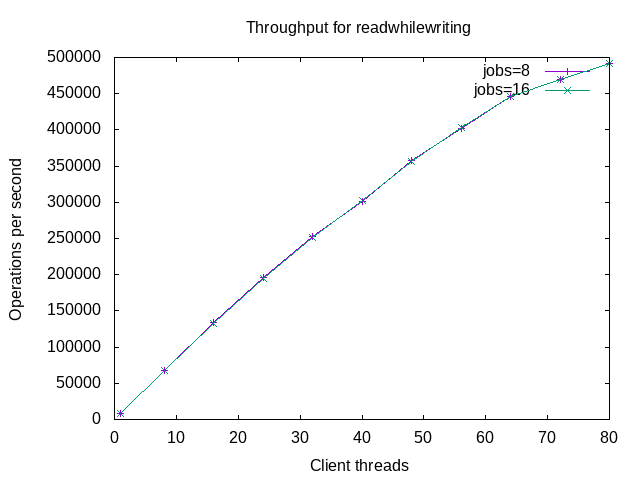
- Throughput improves with concurrency for up to 80 client threads for IO-bound workloads that are read-only or read-mostly. This comes at a reasonable increase in response time, usually <= 1.5x although fwdrangewhilewriting stops improving at 72 client threads.
- Throughput for overwrite (write-only) degrades with concurrency. The peak is at <= 16 client threads. This isn't a surprise, as there is no fsync on write and the additional client threads just compete with compaction threads for CPU although the interference is interesting (keep on reading).
- Throughput for overwrite is ~1.4X better with max_background_jobs=16 vs =8 on average. But the cost of better average throughput is more variance.
For now I will stick with jobs=8 when doing benchmarks on this hardware to get better quality of service but less throughput for overwrite.
Details
Something I learned recently is that the number of flush threads is max_background_jobs/4 and the number of compaction threads is max_background_jobs minus the number of flush threads. The code is here.
I used benchmark.sh, a server with 80 HW threads (hyperthreading enabled) and fast storage. The workload was IO-bound -- 4B KV pairs, ~1TB database and a low cache hit rate. The benchmarks were run for 1, 8, 16, 24, 32, 40, 48, 56, 64, 72 and 80 client threads using two configurations that only differed in the configuration value for max_background jobs -- 8 vs 16. Note that fillseq always uses 1 client thread.
I used a recent build of db_bench at git hash 7e2004a123. This has code that will become the 7.5 release. It includes two changes that greatly reduce the worst-case write stall (6115254 and b397dcd) but that is a topic for another post.
The sequence of benchmark steps is determined by benchmark_compare.sh and the interesting steps were: fillseq, readrandom, multireadrandom, fwdrangewhilewriting, readwhilewriting and overwrite. The *whilewriting steps used a 2MB/s rate limit on the background writer and were not write heavy. The fillseq step is write heavy but doesn't require compaction because inserts are in key order and the push down optimization is used. The final step, overwrite, is write heavy. Command lines are here for a run with 8 client threads and max_background_jobs=8.
I neglected to use --multiread_batched=true with the multireadrandom benchmark step so the results are mostly a duplicate of readrandom.
The benchmark summaries are here for 1, 8, 16, 24, 32, 40, 48, 56, 64, 72 and 80 client threads.
These benchmarks might suffer from coordinated omission because a fixed number of client threads is used. These results might also overstate the benefit of more throughput from more concurrency because the benchmark client doesn't enforce a response time SLA.
Results: throughput
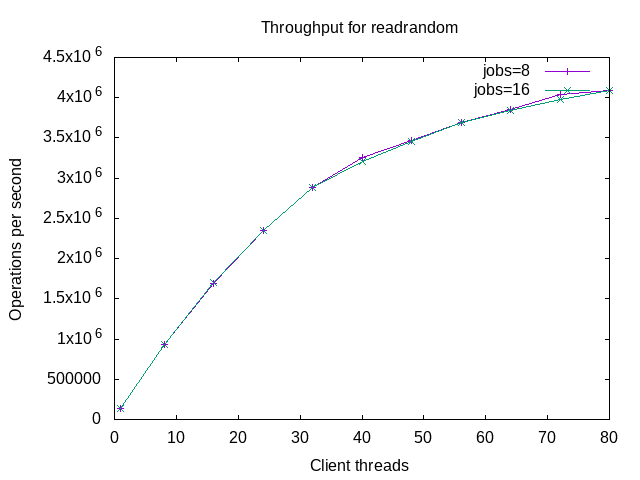
The throughput graphs have results for 1, 8, 16, 24, 32, 40, 48, 56, 64, 72 and 80 client threads.
I used gnuplot for the graphs and did not set the y-range to zero. This was done to make it easier to see the differences but can mislead a drive-by reader. I also use jobs= rather than max_background_jobs= to save on typing. I also used lines rather than bars. Next time I might use bars.
Throughput for fillseq was slightly better with jobs=8 than =16. The difference is small and I won't try to explain it. The fillseq benchmark step does inserts in key order and always uses 1 client thread.
Throughput for readrandom improves with concurrency up to 80 client threads but the improvement degrades and USL might explain that. There is no difference between jobs=8 and =16. That is expected because this is read-only.
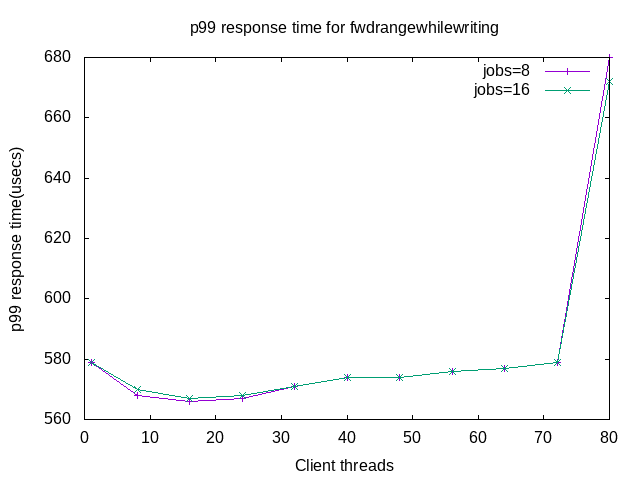
The results for fwdrangewhilewriting are similar to readrandom. There is no difference between jobs=8 and =16. That is probably because the write rate is low (2MB/s).
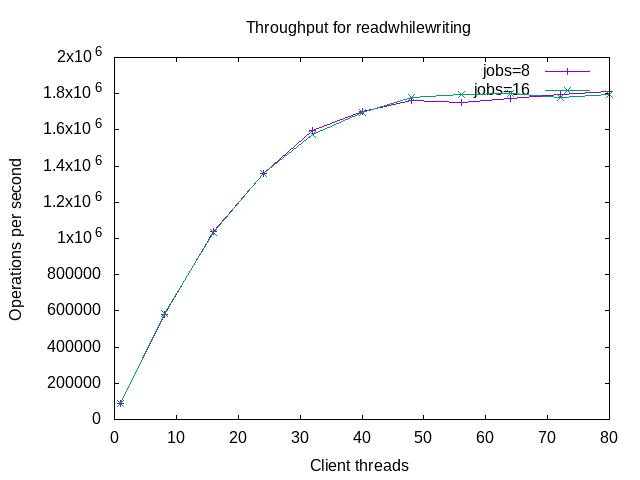
The results for readwhilewriting are similar to readrandom.
The throughput for overwrite is ~1.4X better for jobs=16 than =8. I didn't expect this but it is not a huge surprise. Write amplification during this test is ~17. Compaction IO statistics from the test end are here. The LSM tree has data in 8 levels so this is one example where the write-amp estimate of per-level fanout X number-of-levels is pessimistic.
Results: p99 response time
These graphs show the p99 response time in microseconds.
The results for readrandom and multireadrandom are interesting but I won't try to explain them.
The p99 response time for fwdrangewhilewriting shows that saturation happens after 72 client threads. That it happens at some point is expected.
The p99 response time for readwhilewriting doesn't show the saturation that is visible above for fwdrangewhilewriting.
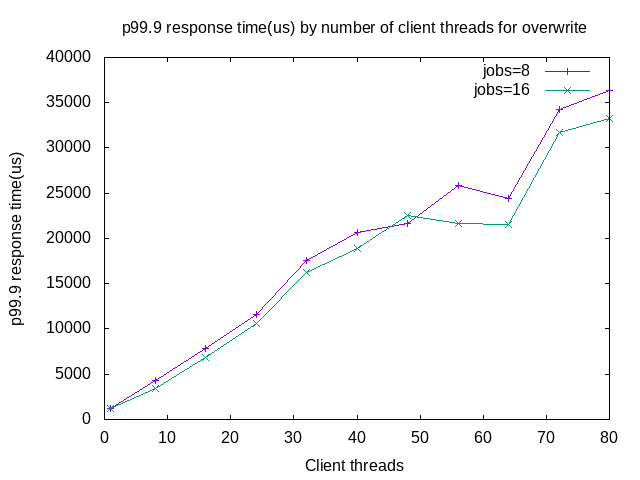
The p99 response time for overwrite is the most interesting. Above it was shown that throughput for jobs=16 was ~1.4X better than for =8. But here the p99 response times are similar. While I haven't displayed it, the p50 response times are also similar. This will be explained below.
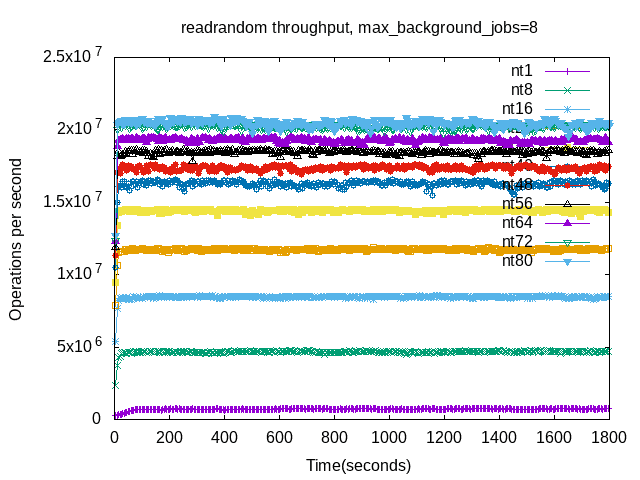
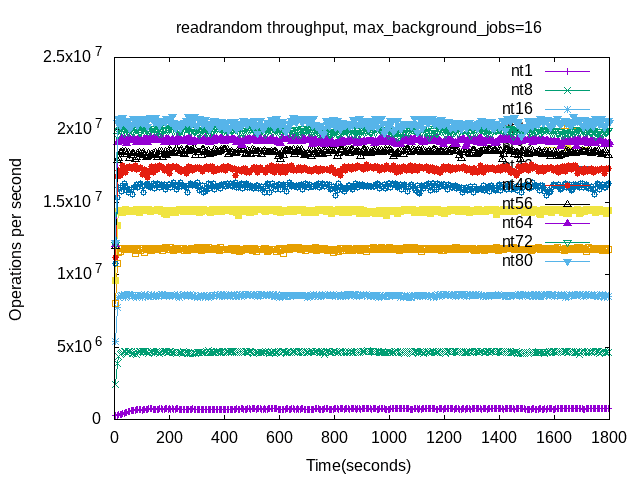
Throughput vs time
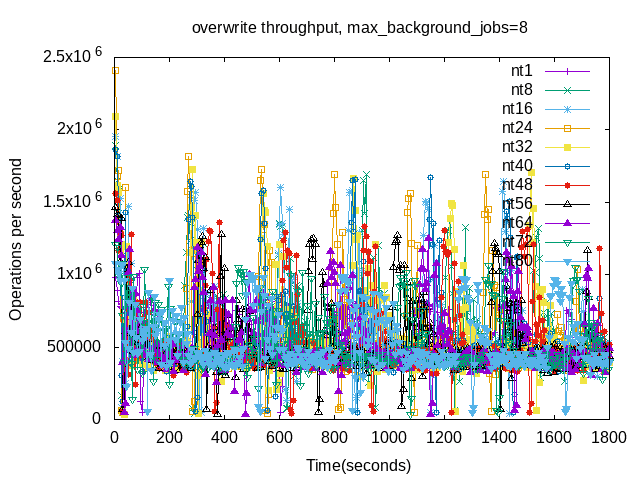
Next up is graphs for throughput vs time at 5-second intervals and I just wrote a note to myself change this to 1-second intervals for future tests. For each benchmark step there are two graphs, one for jobs=8 and another for jobs=16, with 11 lines per graph. There is one line for each number of threads, from 1 to 80 and they are labeled as nt$X on the graph where $X is the number of threads.
The results for fillseq show more variance at first glance for jobs=8 but that might be an illusion because the max for the y-range is larger for jobs=16. The throughput range in both cases is between ~100k/second and ~300k/second after 2000 seconds.
For readrandom the variance increases with the number of client threads. The result for 80 client threads (nt80) has the most jitter. Results for multireadrandom are similar and I won't show them here.
Results for fwdrangewhilewriting show increasing variance as the number of client threads increases.
Results for readwhilewriting show increasing variance as the number of client threads increases.
The overwrite benchmark step has the most interesting graphs although it can be hard to see that here given there are 11 lines per graph. That will be fixed below if you keep on reading. Important points are:
- The worst-case write stall (minutes long) doesn't occur because it was recently fixed. I will explain more about that soon in another blog post.
- The result for jobs=8 shows a regular pattern of a peak then a gradual decline.
- The result for jobs=16 has more variance.
Which do you prefer -- better average throughput or less variance? Obviously, both is my answer.
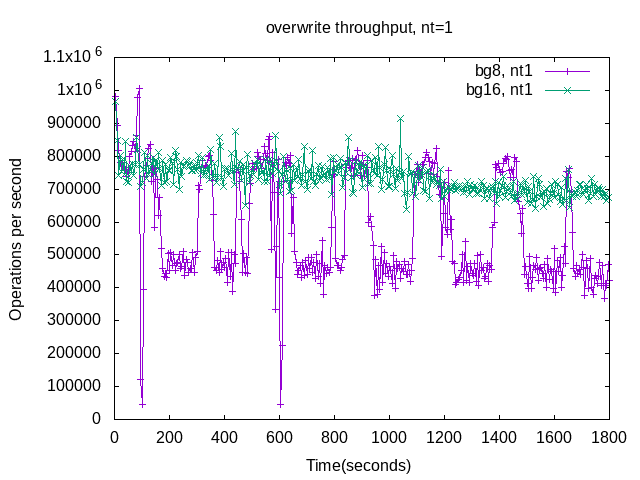
The graphs above for overwrite are busy so I also have graphs limited to a specific number of client threads -- 1, 8 and 32. The problem with variance for jobs=16 doesn't occur at 1 client thread (nt1) but does occur at 8 or more client threads. I hope to explain this one day. For now I will wave my hands and claim that the additional client threads interfere with the compaction threads -- for mutexes and CPU time.
Overwrite: the mystery about p50 and p99
Above I showed that overwrite has similar p99 response times for jobs=8 and jobs=16 but average throughput is ~1.4X better for jobs=16. I didn't show it but the p50 response times are also similar. But in the p99.9 and p99.99 results (no graphs but read the summaries linked above) the values are worse for jobs=16.
The problem is that outliers are worse for jobs=8 and one way to view that is via the response time histrograms printed at the end of the benchmark step. They are here for the nt1 (1 client thread) test. With jobs=16, 99.278% of responses take <= 10 usecs vs (see here and here).
While they are listed in the summaries linked above I don't have graphs for the write stall% from overwrite as this post is already too long. But from the linked summaries at 1 client thread the write stall% is 24.6 for jobs=8 vs 0% for jobs=16. At 8 client threads it is 54.2% for jobs=8 vs 33.1% for jobs=16.