Wednesday, April 26, 2023

Time to compile Postgres, MySQL and MyRocks

I measured the time it takes to build Postgres, upstream MySQL and FB MySQL from source on my home servers (Beelink, see here) using Postgres 15.2, upstream MySQL 8.0.32 and FB MySQL 8.0.28. 

tl;dr

  • Build times in seconds: 619 for Postgres, 5294 for upstream MySQL, 8443 for FB MySQL
  • Postgres is by far the fastest to compile. Reasons for that include that it uses C and has fewer things to compile
  • FB MySQL spends ~2700 seconds compiling RocksDB related things. Without that overhead the FB MySQL build would be 5601 seconds vs 5294 for upstream MySQL. For reasons I don't understand yet, most of the RocksDB source files are compiled 3 times (for the storage engine, ldb binary and sst_dump binary). If that could be avoided then the build time would be reduced by ~20%.

Setup

While the server has 8 cores I did a non-parallel make (make -j1). 

The build configuration (configure & CMake command lines) for each DBMS is here.

Methods

For Postgres I just measure the total time to build. For upstream and FB MySQL I also measure the time for each build target. That is done in two steps.

  1. Run make and add timestamps to the output. Smart people on Twitter explained how to do that.
  2. Parse the output from make to get per-target compile times
To run make I did:
make 2>&1 | ts '[%s]' | tee o.time
To parse the output I did:
grep "Built target" o.time | tr '[]' ' ' | \
awk '{ $2=""; $3=""; $4=""; print $0 }' | \
awk '{ if (NR==1) { printf "%s\t%s\n", $1 - itime, $2 } else { printf "%s\t%s\n", $1 - lastTS, $2 };  lastTS=$1 } ' itime=$firstTS | \
sort -rnk 1,1 | head -10
Results: summary

Legend

* Time(s) - total time for build in seconds
* Targets - number of build targets, only printed for MySQL

Time(s) Targets DBMS
619     NA      Postgres
5294    255     upstream MySQL
8443    251     FB MySQL

Results: detailed

The time in seconds for the top-20 build targets

For upstream MySQL 8.0.32:

1035    sql_main
636     innobase
433     sql_gis
393     sql_dd
301     group_replication
294     perfschema
209     icui18n
190     mysqld
153     libprotoc
128     icuuc
123     libprotobuf
99      slave
96      binlog
65      mysql_server_component_services
65      mysqlgcs
54      mysys_objlib
49      myisam_library
44      mysqlpump_lib
33      libprotobuf-lite
30      mysqlbinlog

For FB MySQL:

The RocksDB related build targets are rocksdb_se, ldb and sst_dump. From the output it looks like each of those repeats the same work -- as all or most of the RocksDB source files are recompiled for each. That explains why each target takes ~900 seconds. If the recompile could be avoided then the build time would be reduced by ~20%.

1201    sql_main
993     rocksdb_se
932     ldb
917     sst_dump
598     innobase
462     sql_dd
411     sql_gis
334     group_replication
332     perfschema
227     mysqld
212     icui18n
153     libprotoc
131     slave
129     icuuc
123     libprotobuf
97      binlog
65      mysqlgcs
57      mysys_objlib
54      mysql_server_component_services
47      myisam_library

Tuesday, April 25, 2023

Perf regressions in MySQL/InnoDB, a big server & sysbench, part 2

My last post has results for MySQL/InnoDB on a big server and the database fit in the InnoDB buffer pool. Here I have results where the database fits in the OS page cache but not the InnoDB buffer pool.

The context for the results is short-running queries, in-memory (cached by the OS) with high-concurrency (20 clients) on a big server (30-cores). The goals are:

  1. Understand the impact of compiler optimizations
  2. Document how performance has changed from MySQL 5.6 to 5.7 to 8.0
  3. Document performance with fast storage (reading from the OS page cache is fast)
tl;dr
  • The rel_lto build improves QPS by up to 3%
  • 8.0 releases look much better here with a big server & high-concurrency than on the small server with low-concurrency.
  • For changes from 5.6 to 8.0
    • Point queries - version 8.0.32 gets about 3X more QPS than 5.6.51 on most of the microbenchmarks. This is much better than the previous result where the database fits in the buffer pool.
    • Range queries - version 8.0.32 gets about 14% more QPS than 5.6.51. This is much better than the previous result where the database fits in the buffer pool.
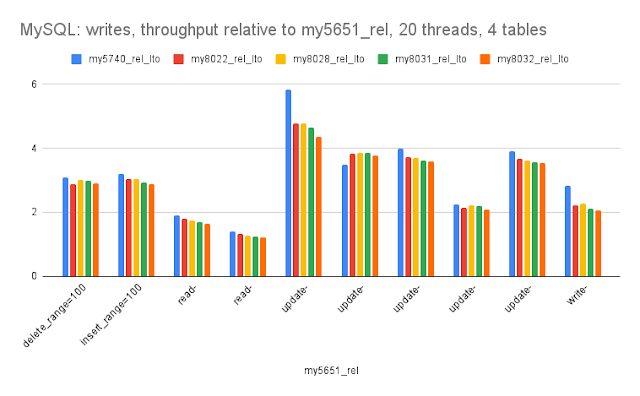
    • Writes - version 8.0.32 gets the same QPS as version 5.6.51. This is much worse than the previous result where the database fits in the buffer pool.
Benchmark

A description of how I run sysbench is here. Tests use the a c2-standard-60 server on GCP with 30-cores, hyperthreading disabled, 240G RAM and 3TB of local attached NVMe. The sysbench tests were run for 20 clients, 600 seconds per microbenchmark using 4 tables with 50M rows per table. All tests use the InnoDB storage engine. The test database fits in the InnoDB buffer pool.

I used a similar configuration (my.cnf) for all versions which is here for 5.65.78.0.2x and 8.0.3x.

Builds

I tested MySQL versions 5.6.51, 5.7.40, 8.0.22, 8.0.28, 8.0.31 and 8.0.32 using multiple builds for each version. For each build+version the full set of sysbench microbenchmarks was repeated. More details on the builds are in the previous post. To save time I only tested all builds for 8.0.31 and for other versions used the rel_lto build.

Results: all versions

The spreadsheet is here. See the 56_to_80.redo.4g tab.

The graphs use relative throughput which is throughput for me / throughput for base case. When the relative throughput is > 1 then my results are better than the base case. When it is 1.10 then my results are ~10% better than the base case. The base case here is MySQL 5.6.51 using the rel_lto build.

There are three graphs per version which group the microbenchmarks by the dominant operation: one for point queries, one for range queries, one for writes. There is much variance within each of the microbenchmark groups:
  • Point queries - most of the microbenchmarks get about 3X more QPS in 8.0 than 5.6. The exceptions are hot-points_range=100, point-query.pre_range=100 and point-query.range=100. Two of the exceptions select one row per query while the microbenchmarks that are 3X faster tend to have a large in-list.
  • Range queries - most of the microbenchmarks have a relative throughput between 0.8 and 1.2 with 8.0 compared to 5.6.51. There are two outliers that are more than 3X faster in 8.0 -- range-notcovered-si.pre_range=1000 and range-notcovered-si_range=1000 which use oltp_points_covered.lua. The two exceptions do a range scan on a non-covering secondary index so there will be more reads from the OS page cache for these.
  • Writes - there is not much variance in the microbenchmarks except for read-write* which use the classic sysbench transaction that includes range queries. Perhaps their improvement in 8.0 vs 5.6 is mostly do to the improvements in range queries, but their cousin (read-only*) which uses the same SQL excluding the writes doesn't show such an improvement. This is a mystery.
Summary statistics:

my5651_relmy5740_rel_ltomy8022_rel_ltomy8028_rel_ltomy8031_rel_ltomy8032_rel_lto
Point: avg1.712.672.752.712.70
Point: median1.582.882.983.153.19
Point: min1.031.021.010.990.98
Point: max5.113.733.763.703.37
Point: stddev0.8970.7940.8610.8440.840
Range: avg1.291.471.501.421.42
Range: median1.251.241.191.151.14
Range: min0.810.710.730.680.62
Range: max2.293.473.603.443.44
Range: stddev0.3680.8340.8970.8470.858
Write: avg1.221.091.071.061.06
Write: median1.181.021.011.001.01
Write: min0.980.890.950.940.95
Write: max1.521.551.331.331.33
Write: stddev0.2000.2200.1420.1340.132

Results: MySQL 8.0.31

The spreadsheet is here. See the my8031.redo.4g tab.

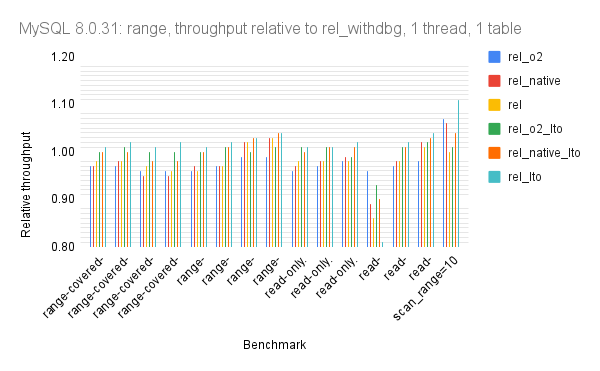
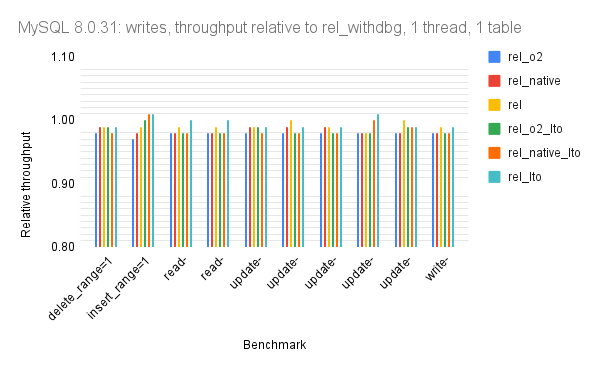
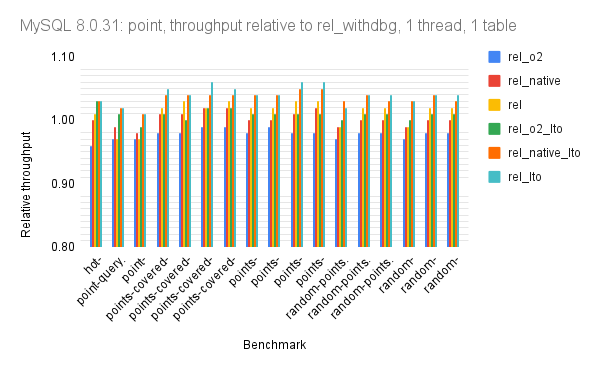
The graphs use relative throughput which is throughput for me / throughput for base case. When the relative throughput is > 1 then my results are better than the base case. When it is 1.10 then my results are ~10% better than the base case. The base case here is MySQL 8.0.31 using the rel_withdbg build.

There are three graphs per version which group the microbenchmarks by the dominant operation: one for point queries, one for range queries, one for writes. For each group of microbenchmarks:
  • Point queries - there is little variance across the microbenchmarks
  • Range queries - the full table scan test (scan_range=10) shows the best improvement from the rel_lto build. I don't understand the noisy result for the read-only_range=10000 microbenchmark. Perhaps buffer pool writeback was still in progress as that microbenchmark is run shortly after the write-heavy microbenchmarks.
  • Writes -  there is little variance across the microbenchmarks
Summary statistics:

rel_withdbgrel_o2rel_nativerelrel_o2_ltorel_native_ltorel_lto
Point: avg0.981.021.021.011.031.03
Point: median0.991.021.021.011.031.03
Point: min0.950.960.971.001.011.01
Point: max1.011.031.031.021.061.05
Point: stddev0.0170.0210.0180.0070.0110.011
Range: avg0.980.980.981.001.001.01
Range: median0.970.980.981.011.011.02
Range: min0.960.890.860.930.900.81
Range: max1.071.061.031.021.041.11
Range: stddev0.0280.0400.0380.0210.0340.061
Write: avg0.980.980.990.990.991.00
Write: median0.980.980.990.980.980.99
Write: min0.970.980.980.980.980.99
Write: max0.980.991.001.001.011.01
Write: stddev0.0030.0050.0060.0070.0110.008

    Perf regressions in MySQL/InnoDB, a big server & sysbench

    I used sysbench to test MySQL/InnoDB performance on a big server. This is similar to the results I shared for InnoDB vs sysbench on a small server. The context for the results is short-running queries, in-memory (cached by InnoDB) with high-concurrency (20 clients) on a big server (30-cores). The goals are:

    1. Understand the impact of compiler optimizations
    2. Document how performance has changed from MySQL 5.6 to 5.7 to 8.0
    tl;dr
    • The rel_lto build gets 4%, 0% and 3% more QPS for point query, range query and write microbenchmarks compared to the rel_withdbg build for MySQL 8.0.31. This is similar to the benefit measured on the small server. Link-time optimization is nice.
    • 8.0 releases look much better here with a big server & high-concurrency than on the small server with low-concurrency.
    • For changes from 5.6 to 8.0
      • Point queries - version 8.0.32 gets about 4% more QPS (on average) versus version 5.6.51. But microbenchmarks that use the PK index do better than average while ones that use the secondary index do much worse than average where much worse means getting about 25% less QPS than 5.6.51.
      • Range queries - version 8.0.32 gets about 22% less QPS versus version 5.6.51. The regressions have been gradual from 5.6 to 5.7 to 8.0.
      • Writes - version 8.0.32 gets almost 3X more QPS versus version 5.6.51. All of that improvement is between 5.6.51 and 5.7.40.

    Benchmark

    A description of how I run sysbench is here. Tests use the a c2-standard-60 server on GCP with 30-cores, hyperthreading disabled, 240G RAM and 3TB of local attached NVMe. The sysbench tests were run for 20 clients, 600 seconds per microbenchmark using 4 tables with 50M rows per table. All tests use the InnoDB storage engine. The test database fits in the InnoDB buffer pool.

    I used a similar configuration (my.cnf) for all versions which is here for 5.65.7, 8.0.2x and 8.0.3x.

    Builds

    I tested MySQL versions 5.6.51, 5.7.40, 8.0.22, 8.0.28, 8.0.31 and 8.0.32 using multiple builds for each version. For each build+version the full set of sysbench microbenchmarks was repeated. More details on the builds are in the previous post. To save time I only tested all builds for 8.0.31 and for other versions used the rel_lto build.

    Results: all versions

    The spreadsheet is here. See the 56_to_80.redo tab.

    The graphs use relative throughput which is throughput for me / throughput for base case. When the relative throughput is > 1 then my results are better than the base case. When it is 1.10 then my results are ~10% better than the base case. The base case here is MySQL 5.6.51 using the rel_lto build.

    There are three graphs per version which group the microbenchmarks by the dominant operation: one for point queries, one for range queries, one for writes. There is much variance within each of the microbenchmark groups:
    • Point queries - most of the regressions, where the relative throughput is much less than 1, occur on microbenchmarks that use the secondary index. See the spreadsheet for the full microbenchmark names as they are cutoff on the graphs below. So on average 8.0.32 gets about 4% more QPS than 5.6.51 but that can hide something. For microbenchmarks that use the PK index the QPS from 8.0.32 is usually much more than 4% better than 5.6.51. For microbenchmarks that use the secondary index the QPS from 8.0.32 is usually about 25% less than 5.6.51. 
    • Range queries - results are in three classes. 
      • The first class gets about 22% less QPS versus 5.6.51. These do a variety of range scans using the PK or secondary index. For some the index is covering, for others it is not.
      • The second class gets about 12% more QPS versus 5.6.51. The Lua script for all of these is oltp_read_only.lua which is the classic sysbench transaction excluding writes.
      • The final class has but one microbenchmark that does a full table scan (scan_range*) and 5.6.51 will soon be 2X faster than modern MySQL for that microbenchmark.  
    • Writes - while there is much variance in the relative throughput across the microbenchmarks in this group, in all cases the throughput with 8.0 is much better than 5.6.51. The read-write* microbenchmarks have the least improvement in 8.0 versus 5.6.51 but those use oltp_read_write.lua which is the classic sysbench transaction and that includes range queries in addition to the writes.
    Summary statistics:

    my5651_relmy5740_rel_ltomy8022_rel_ltomy8028_rel_ltomy8031_rel_ltomy8032_rel_lto
    Point: avg1.100.970.940.960.95
    Point: median1.230.930.911.061.04
    Point: min0.810.750.720.720.72
    Point: max1.361.291.151.191.18
    Point: stddev0.2010.1690.1530.1700.165
    Range: avg1.040.970.950.900.88
    Range: median0.890.860.810.780.78
    Range: min0.740.760.760.630.60
    Range: max1.401.231.211.161.14
    Range: stddev0.2530.2030.1990.2100.208
    Write: avg3.192.942.952.892.81
    Write: median3.152.953.032.962.90
    Write: min1.411.321.281.241.21
    Write: max5.834.774.794.664.35
    Write: stddev1.2511.0751.0761.0711.023

    Results: version 8.0.31

    The spreadsheet is here. See the my8031.redo tab.

    The graphs use relative throughput which is throughput for me / throughput for base case. When the relative throughput is > 1 then my results are better than the base case. When it is 1.10 then my results are ~10% better than the base case. The base case here is MySQL 8.0.31 using the rel_withdbg build.

    There are three graphs per version which group the microbenchmarks by the dominant operation: one for point queries, one for range queries, one for writes. For each group of microbenchmarks:
    • point queries show little variance
    • range queries show little variance except on the full scan (scan_range=10). I suspect that is noise from the microbenchmark rather than from compiler optimizations
    • writes show little variance
    Summary statistics:

    rel_withdbgrel_o2rel_nativerelrel_o2_ltorel_native_ltorel_lto
    Point: avg0.981.001.011.011.041.04
    Point: median0.981.001.021.011.041.04
    Point: min0.960.980.970.991.011.01
    Point: max0.991.021.031.031.051.06
    Point: stddev0.0080.0110.0200.0090.0100.014
    Range: avg0.980.980.991.000.991.01
    Range: median0.980.970.971.000.991.00
    Range: min0.970.940.960.970.940.97
    Range: max1.061.141.141.011.031.04
    Range: stddev0.0230.0480.0460.0100.0250.019
    Write: avg0.980.990.991.011.031.03
    Write: median0.980.990.991.001.031.03
    Write: min0.970.960.961.001.001.01
    Write: max1.001.031.021.051.051.06
    Write: stddev0.0080.0200.0180.0210.0180.019