Monday, January 23, 2023

The insert benchmark on ARM and x86 cloud servers

I used the insert benchmark to compare ARM and x86 servers on AWS. For ARM I used c7g and for x86 I used c6i. The goal was to compare ARM vs x86 on similar hardware (OS, vcpu, RAM and EBS setups were the same). 

While I am not trying to start a benchmarketing battle for c7g vs c6i or Postgres vs MySQL, I suppose that might happen. My goal in doing comparisons like this is to find things that can be improved. Also, in-memory workloads aren't the target use case for MyRocks. It doesn't do great on them. It does do great on write and space efficiency, but those don't matter here. Were this an IO-bound benchmark the MyRocks results would look much better in comparisons.

tl;dr

  • Performance for x86 (c6i) and Arm (c7g) were mostly similar for medium and high concurrency while x86 was faster at 1 client thread. But there were large differences on the high concurrency tests for Postgres - in a few cases Arm did much better, in a few x86 did much better.
  • Some performance problems, like the Postgres QPS drop off at high concurrency, might be resolved by using better compiler flags in the build. Figuring that out is future work.
  • Hyperthreading on Intel rarely improved performance and frequently hurt it
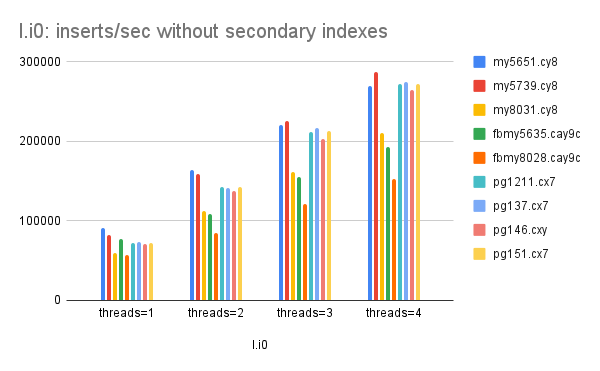
  • For inserts in PK order without secondary indexes
    • Perf at low concurrency is similar for MyRocks and InnoDB and slightly better for Postgres
    • MyRocks does the worst as concurrency & instance size grow
  • For inserts in PK order with 3 secondary indexes
    • Perf at low concurrency is similar
    • MyRocks does the worst and Postgres the best as concurrency & instance size grow
  • For range queries with background writes
    • InnoDB is slightly faster than MyRocks, Postgres is much faster than both
    • Postgres does the best as concurrency & instance size grow with one exception. On the 16xlarge instance Postgres QPS is better with 22 threads than with 44 on Arm (c7g), but on x86 (c6i) the QPS is better with 44 threads as expected.
    • The usage of prepared statements improves Postgres QPS by ~1.25X for q100, q500 and q1000 on 16xl.22t. I have to make prepared statements work for MySQL, or at least get good results, 

Compiling

The benchmark was repeated for Postgres 15.1, MySQL 8.0.31 with InnoDB and FB MySQL 8.0.28 with MyRocks. All were compiled from source with gcc (gcc 11.3.0 on Ubuntu 22.04) and I didn't go out of my way to change the compiler flags.

For the builds on ARM:

  • MySQL uses -march=armv8-a+crc for all (or most) files
  • MyRocks uses -march=armv8-a+crc+crypto for all (or most) files
  • Postgres uses -march=armv8-a+crc for a few files -- the ones related for crc32c
For the builds on x86:
  • MySQL doesn't use -march, -mtune or -mcpu. It does use -O2.
  • MyRocks uses -march=native and -O2.
  • Postgres doesn't use -march, -mtune or -mcpu. It does use -O2.
The -march flags used above are what you get with builds if you don't do anything special. However, it isn't clear that this will get me support for LSE instructions on Arm that might be important on large (many core) servers. For the Arm builds I used here, compiled with -march=armv8-a+crc, I see LSE instructions as mentioned here. But I still wonder whether builds with -mcpu=native would have done better.

Builds can be complicated because gcc doesn't support some flags for both Arm and x86. Some build advice is here, here and here. My general advice at this point is the following but I have yet to determine whether this is good advice:
  • Arm -> use -mcpu=native for clang and gcc. Perhaps -mcpu=neoverse-512tvb is better, but -mcpu=native is easier to remember.
  • x86 -> use -march=native for clang and gcc

Benchmark

An overview of the insert benchmark is here and an update is here. I used a CPU-bound workload, the database fits in the DBMS cache so there were no reads from storage but many writes.

The benchmark was repeated for Postgres 15.1, MySQL 8.0.31 with InnoDB and FB MySQL 8.0.28 with MyRocks.

The insert benchmark was run with 6 steps:

  • l.i0 - insert X rows without secondary indexes
  • l.x - create 3 secondary indexes. I ignore performance for this step. Some of the tested DBMS do a parallel index create that I haven't tried to tune.
  • l.i1 - insert Y rows with 3 secondary indexes in place
  • q100 - queries with 100 inserts/s/thread in the background, runs for 1 hour
  • q500 - queries with 500 inserts/s/thread in the background, runs for 1 hour
  • q1000 - queries with 1000 inserts/s/thread in the background, runs for 1 hour
The size of the insert benchmark per instance size (see above for X and Y):

  • 2xlarge - X=10M, Y=10M, 1 thread
  • 4xlarge - X=25M, Y=25M, 4 & 8 threads
  • 8xlarge - X=75M, Y=25M, 8 & 16 threads
  • 16xlarge - X=150M, Y=50M, 22 & 44 threads

Servers

All servers use Ubuntu 22.04 with database storage on EBS (io2). The EBS setups for each vcpu size were the same between c7g and c6i except for the 16xlarge case where c7g gets more IOPs (I made a mistake there).

For ARM I used:

  • c7g.2xlarge
    • 8 vcpu, 8 CPU, 16G RAM, EBS (256G, io2, 10k IOPs)
  • c7g.4xlarge
    • 16 vcpu, 16 CPU, 32G RAM, EBS (1T, io2, 32k IOPs)
  • c7g.8xlarge
    • 32 vcpu, 32 CPU, 64G RAM, EBS (2T, 49k IOPs)
  • c7g.16xlarge
    • 64 vcpu, 64 CPU, 128G RAM, EBS (5T, 100k IOPs)

For x86 I used:

  • c6i.2xlarge
    • 8 vcpu, 4 CPU, 16G RAM, EBS (256G, io2, 10k IOPs), hyperthread disabled
  • c6i.4xlarge
    • 16 vcpu, 8 CPU, 32G RAM, EBS (1T, io2, 32k IOPs), hyperthread disabled
  • c6i.8xlarge
    • 32 vcpu, 16 CPU, 64G RAM, EBS (2T, io2, 49k IOPs), hyperthread disabled
  • c6i.16xlarge
    • 64 vcpu, 32 CPU, 128G RAM, EBS (5T, io2, 64k IOPs), hyperthread disabled
Database config files by instances size:

I disable hyperthreading for x86 as that tends to hurt benchmark QPS and/or QoS thus /proc/cpuinfo shows that the ARM servers have 2X the CPUs. For the 16xlarge instance this (HT doesn't help perf) is mostly true for most of the DBMS X benchmark steps at 22 threads and somewhat true at 44 threads:

  • Results without and with hyperthreading for 22 client threads
  • Results without and with hyperthreading for 44 client threads

Results

Performance summaries are here. A brief guide to reading them is here:

Graph

For the graphs below:
  • fbmy8028.c6i and fbmy8028.c7g are for MyRocks on c6i and c7g
  • my8031.c6i and my8031.c7g are for InnoDB on c6i and c7g
  • pg151.c6i and pg151.c7g are for Postgres on c6i and c7g
  • 2xl.1t is 2xlarge with 1 thread (client)
  • 4xl.4t is 4xlarge with 4 threads (clients)
  • 4xl.8t is 4xlarge with 8 threads (clients)
  • 8xl.8t is 8xlarge with 8 threads (clients)
  • 8xl.16t is 8xlarge with 16 threads (clients)
  • 16xl.22t is 16xlarge with 22 threads (clients)
  • 16xl.44t is 16xlarge with 44 threads (clients)
For loads in PK order without secondary indexes:
  • Results are similar between Arm and x86
  • Results are similar between DBMS at low concurrency but as server size and concurrency increases Postgres does the best and MyRocks does the worst.
For loads in PK order with 3 secondary indexes:
  • Results are similar between Arm and x86 but Arm does better for Postgres at high concurrency
  • Results are similar between DBMS at low concurrency but as server size and concurrency increases Postgres does the best and MyRocks does the worst.
For range queries with some background inserts:
  • Results are similar between Arm and x86 although results for Postgres at high concurrency are odd, especially for 16xl.44t (16xlarge, 44 threads) where QPS for c7g is bad on Arm but good on x86. Perhaps one issue is the compiler optimization flags mentioned above.
  • Postgres gets much more QPS than MySQL. One reason is that the benchmark uses prepared statements for Postgres but I have yet to make that work for MySQL. The usage of prepared statements improves Postgres QPS by ~1.25X for q100, q500 and q1000 on 16xl.22t.


For range queries with more background inserts the results below are similar to the results above.
And for range queries with even more background inserts the results here are similar to the results above.

Explaining results

For the results at low concurency (2xl.1t -> 2xlarge, 1 client/thread):
  • Results were better for x86 than for Arm.
  • For l.i0 the CPU usecs/insert (cpupq) is 10 for Postgres, 11 for InnoDB and 12 for MyRocks. So Postgres has the least CPU overhead. For cpupq see here for x86 and for Arm
  • For l.i1 the CPU usecs/insert (cpupq) is 24 for Postgres, 27 for InnoDB and 38 for MyRocks. Again, Postgres has the least CPU overhead. For cpupq see here for x86 and for Arm.
  • For the range query with background insert tests Postgres QPS is ~2X the QPS for MyRocks and InnoDB because the CPU usecs/query (cpupq) is at least 2X larger for MySQL than for Postgres. For cpupq see here for x86 and for Arm. For the q100 benchmark step the CPU usecs/query is 53 for Postgres, 109 for InnoDB and 140 for MyRocks. One issue is that I am able to use prepared statements for Postgres but have yet to make them work, or get good results with them, for MySQL.
For the results at medium concurrency (8xl.16t -> 8xlarge, 16 threads):
  • Arm did better than x86 for the load benchmark steps (l.i0, l.i1), but for the range query benchmark steps (q100, q500, q1000) the results for Arm and x86 were similar. While x86 did better than Arm for the 8xl.8t (8xlarge, 8 thread) test. The issue might be that CPU was oversubscribed with x86 for 8xl.16t and the load steps require CPU for background threads to persist the database state. The 8xl server has 32 cores for Arm and 16 for x86 because hyperthreading was disabled. The 8xl.16t benchmark uses 16 threads for inserts and then InnoDB needs some and MyRocks needs more background threads. 
  • For l.i0 and x86 the CPU usecs/insert is 11 for Postgres, 14 for InnoDB and 19 for MyRocks (see cpupq here). For Arm it is 13 for Postgres, 16 for InnoDB and 23 for MyRocks (see cpupq here).
  • For l.i1 and x86 the CPU usecs/insert is 27 for Postgres, 34 for InnoDB and 40 for MyRocks (see cpupq here). For Arm it is 31 for Postgres, 40 for InnoDB and 45 for MyRocks (see cpupq here). The context switch rate (which predicts mutex contention) is smallest for Postgres - see cspq (context switches/query).
  • For range query perf I focus on q100 but q500 and q1000 are similar. For x86 the CPU usecs/insert is 54 for Postgres, 127 for InnoDB and 164 for MyRocks (see cpupq here). For Arm it is 58 for Postgres, 152 for InnoDB and 203 for MyRocks (see cpupq here). The context switch rates are similar for Postgres and MySQL -- about 1.9/query.
For the results at high concurrency where Postgres does OK on ARM (16xl.22t -> 16xlarge, 22 threads):
  • Results are similar between Arm and x86 for the load benchmark steps (l.i0, l.i1). For the range query steps (q100, q500, q1000) the QPS for Arm and x86 is similar for MySQL but for Postgres the Arm results are much better than x86.
  • For l.i0 Postgres has the best insert rates and MyRocks has the worst. For x86 the CPU usecs/insert is 12 for Postgres, 15 for InnoDB and 23 for MyRocks (see cpupq here) and for Arm it is 13 for Postgres, 17 for InnoDB and 25 for MyRocks (see cpupq here). The context switch rate/insert is also lower for Postgres -- see the cspq column (context switches/query).
  • For l.i1 Postgres has the best insert rates and MyRocks has the worst. The CPU usecs/insert is 30 for Postgres, 35 for InnoDB and 45 for MyRocks (see cpupq here) and for Arm it is 30 for Postgres, 40 for InnoDB and 53 for MyRocks (see cpupq here).
  • For the range query benchmark steps (q100, q500, q1000) InnoDB is slightly faster than MyRocks and Postgres is much faster than both. The QPS for Postgres on Arm is much better than on x86. For q100 and x86 the CPU usecs/query is 80 for Postgres, 144 for InnoDB and 175 for MyRocks (see cpupq here). For Arm it is 54 for Postgres, 153 for InnoDB and 196 for MyRocks (see cpupq here). The ratio (cpupq for InnoDB / cpupq for Postgres) is 1.8 on x86 and 2.8 on Arm. The context switch rates are similar between Postgres and MySQL.
For the results at high concurrency where Postgres has problems on ARM (16xl.44t -> 16xlarge, 44 threads):
  • Results are similar between Arm and x86 for l.i0 but have more variance for l.i1 (Postgres and InnoDB did better with Arm, MyRocks did better with x86). For the range query steps (q100, q500, q1000) the QPS for Postgres was much better on x86 than on Arm while the QPS for InnoDB and MyRocks was similar between x86 and Arm.
  • For l.i0 the CPU usecs/insert was 12 for Postgres, 15 for InnoDB and 24 for MyRocks on x86 (see cpupq here). For Arm it was 12 for Postgres, 17 for InnoDB and 33 for MyRocks (see cpupq here). Context switch rates were best for Postgres and much worse for MyRocks on both x86 and Arm (see the cspq value).
  • For l.i1 the CPU usecs/insert was 30 for Postgres, 35 for InnoDB and 48 for MyRock on x86 (see cpupq here). For Arm it was 31 for Postgres, 41 for InnoDB and 58 for MyRocks (see cpupq here). The insert rate for Postgres was ~1.15X better on Arm than x86 and that might be explained by a lower context switch rate (cspq) on Arm (0.457 on Arm, 0.525 on x86). As mentioned elsewhere, this might be a result of an oversubscribed CPU on the x86 benchmarks.
  • For the range query benchmark steps (q100, q500, q1000) the CPU usecs/query is 58 for Postgres, 136 for InnoDB and 171 for MyRocks on x86 (see cpupq here). For Arm it was 119 for Postgres, 218 for InnoDB and 258 for MyRocks (see cpupq here). The context switch rates (cspq) for all DBMs were ~1.9/query on x86 and ~3.9/query on Arm. The bad results for Postgres on Arm might be explained by using ~1.3X CPU/query than on x86.


Tuesday, January 17, 2023

clang, gcc & compiler flags vs the insert benchmark & ARM

I have a large set of results from the Insert Benchmark run on AWS servers that use ARM CPUs (c7g). But before sharing them I wanted to make sure my builds (Postgres and MySQL compiled from source) weren't ruined by using the wrong compiler flags. And by wrong I mean that by default you get a build optimized for an older version of the ARM architecture. The flags that I tried optimize it for something more modern. So I ran a smaller batch of tests to compare the impact of compiler flags for builds with both gcc and clang using for ARM (c7g) instance types.

My goal is to determine whether my larger set of results is truthy, because they were compiled so that MySQL and PG use what they think is right. And my special builds that used things like -march=native, -mcpu=native and -mtune=native, those special builds didn't get significantly better performance. I am in favor of using the =native options.

The conclusion is that my builds were OK and I didn't detect a large benefit from using CPU specific compiler flags. The disclaimer is that my methods won't detect small differences -- some of the tests are short running and I didn't repeat the benchmark enough times to detect such small differences. Regardless, I was happy to learn that my results weren't ruined by using the wrong compiler flags.

Servers

I used c7g instances types (c7g.2xlarge, c7g.8xlarge) on AWS with Ubuntu 22.04. The compilers were clang 14.0.0-1ubuntu1 and gcc 11.3.0-1ubuntu1~22.04, 

The c7g.2xlarge server has 8 cores, 16G RAM and I ran the insert benchmark at 1 thread.  Storage was EBS (io2, 256G, 10k IOPs.

The c7g.8xlarge servers has 32 cores, 64G RAM and I ran the insert benchmark at 8 and 16 threads. Storage was EBS (io2, 2000G, 49k IOPs).

Compiling

I used Postgres 15.1 and MySQL 8.0.31.  By MySQL I mean upstream.

A nice summary of -mtune, -mcpu and -march compiler options is here.

Postgres + gcc was compiled three ways. Later in this post I call them gcc.default, gcc.arch.native and gcc.cpu.native.

1) configure --prefix=$pfx --enable-debug CFLAGS="-O2 -fno-omit-frame-pointer"
2) configure --prefix=$pfx --enable-debug CFLAGS="-O2 -fno-omit-frame-pointer -march=native"
3) configure --prefix=$pfx --enable-debug CFLAGS="-O2 -fno-omit-frame-pointer -mcpu=native"

Postgres + clang was also compiled three ways and I call them clang.default, clang.cpu.native and clang.tune.native. I used -mtnue=native for clang vs -mcpu=native for gcc because clang doesn't support -mcpu=native.

1) configure CC=/usr/bin/clang --prefix=$pfx --enable-debug CFLAGS="-O2 -fno-omit-frame-pointer"
2) configure CC=/usr/bin/clang --prefix=$pfx --enable-debug CFLAGS="-O2 -fno-omit-frame-pointer -march=native"
3) configure CC=/usr/bin/clang --prefix=$pfx --enable-debug CFLAGS="-O2 -fno-omit-frame-pointer -mtune=native"

For the gcc and clang builds with Postgres, ARM related output and CFLAGS are here.

MySQL + gcc was compiled three ways that I call gcc.default, gcc.arch.native and gcc.cpu.native similar to what was done for Postgres. Perhaps my cmake skills are weak, but I ended up editing configure.cmake via  diffs like this to get binaries I call gcc.default, gcc.arch.native and gcc.cpu.native. ARM related output and CFLAGS/CXXFLAGS for each build are here.

MySQL + clang was compiled two ways that I call clang.default and clang.cpu.native. My configure.cmake hack didn't work for -mtune=native so there is no clang.tune.native build. ARM related output and CFLAGS/CXXFLAGS for each build are here.

The MySQL builds were done via cmake like:

cmake .. -DCMAKE_BUILD_TYPE=RelWithDebInfo -DWITH_SSL=system -DWITH_ZLIB=bundled -DMYSQL_MAINTAINER_MODE=0 -DENABLED_LOCAL_INFILE=1 -DCMAKE_INSTALL_PREFIX=$1 -DWITH_BOOST=$PWD/../boost -DWITH_NUMA=ON 
CC=/usr/bin/clang CXX=/usr/bin/clang++ cmake .. -DCMAKE_BUILD_TYPE=RelWithDebInfo -DWITH_SSL=system -DWITH_ZLIB=bundled -DMYSQL_MAINTAINER_MODE=0 -DENABLED_LOCAL_INFILE=1 -DCMAKE_INSTALL_PREFIX=$1 -DWITH_BOOST=$PWD/../boost -DWITH_NUMA=ON

Benchmark

For an overview of the insert benchmark see here and here. I only use the cached workload here and the database fits in the DBMS buffer pool. The read+write benchmark steps were run for 1 hour each. Using terminology from the Benchmark section of my previous post:

  • for c7g.2xlarge - X=20M, Y=20M and there was 1 client thread
  • for c7g.8xlarge - X=75M, Y=25M and the benchmark was repeated for 8 and 16 threads

For the c7g.2xlarge server I used the x7 config file for Postgres and y8 config file for InnoDB. For the c7g.8xlarge server I used the x7_c32r64_50kio config file for Postgres and y8_c32r64_50kio config file for MySQL. Note that I have to edit malloc-lib in the MySQL config files for ARM and add the fix for bug 109429.

A spreadsheet with results (QPS by benchmark step) is here. There are 3 sheets for: c7g.2xlarge with 1 thread, c7g.8xlarge with 8 threads, and c7g.8xlarge with 16 threads. For l.i0 and l.i1 the spreadsheet lists the insert rate. For q100, q500 and q1000 the spreadsheet lists the query rate. Note that l.i0 and l.i1 are short running (not great, I have a replacement for the insert benchmark in progress). Regardless, the results are similar regardless of the compiler flags.

The benchmark steps are:

  • l.i0 - load X (see above) rows in PK order, table only has a PK index
  • l.i1 - load Y (see above) rows in PK order, table has a PK and 3 secondary indexes
  • q100 - each thread does short range queries, and is paired with a background thread that does 100 inserts/s
  • q500 - same as q100, but background thread does 500 inserts/s
  • q1000 - same as q100, but background thread does 1000 inserts/s

Thursday, January 5, 2023

Insert benchmark on an 8-core AMD server

I ran the insert benchmark on a Beelink SER 4700u that has 8 AMD cores, 16G RAM and NVMe SSD. I ran the test using 1, 2, 3 and 4 clients (threads) for MySQL (MyRocks, InnoDB) and Postgres. 

tl;dr

  • MySQL has CPU regressions from 5.6 to 8.0 that hurt performance
  • Postgres does not suffer from such CPU regressions
  • Postgres wasn't able to sustain the target insert rate (4000/s) for the IO-bound workload at 4 threads. InnoDB was able to thanks to the change buffer that reduces the IO overhead of secondary index maintenance. MyRocks also did great because non-unique secondary index maintenance is read free, so it is even more IO efficient than InnoDB.
  • InnoDB does so much more IO/query than Postgres and MyRocks with the IO-bound workloads courtesy of MySQL bug 109595. I have been aware of this odd result for 10+ years and finally got the chance to debug it.
  • MyRocks did much better than InnoDB and Postgres on l.i1 because non-unique secondary index maintenance is read free
Benchmark

For an overview of the insert benchmark see here and here. I ran it for two configurations: cached and IO-bound. The benchmark is a sequence of steps. The steps and their names are:
  • l.i0 - insert X rows without secondary indexes
  • l.x - create 3 secondary indexes
  • l.i1 - insert another Y rows with the overhead of secondary index maintenance
  • q100.1 - do queries as fast as possible with 100 inserts/s/thread done in the background
  • q500.1 - do queries as fast as possible with 500 inserts/s/thread done in the background
  • q1000.1 - do queries as fast as possible with 1000 inserts/s/thread done in the background

    For cached X=20M and Y=20M. For IO-bound X=500M and Y=10M.

    The insert benchmark has a few problems so I will replace it later this year. The problems include:
    • The Python code uses too much CPU
    • The l.i0 and l.i1 steps are insert-only and can't run for a long time for workloads that are intended to stay in-memory.
    • The read+write steps (q100.1, ...) that measure query performance are easily cached by some DBMS (like Postgres) but not by others which makes comparisons hard for workloads intended to be IO-bound.
    • I don't test the ability to replicate the high write rates sustained by l.i0 and l.i1. That takes more time to setup, more hardware and a good network switch. Note this problem is likely to repeat with whatever replaces the insert benchmark.
    • The benchmark clients (Python) share the server. This is unlikely to match how the DBMS is used in production. It also skips some of the networking code in the DBMS.
    Reports

    Performance summaries generated by shell scripts are below. A short guide to these results is here.
    Reports: cpu regression

    These help explain performance especially the regressions for MySQL from 5.6 to 8.0. The cpupq column is the amount of CPU consumed per operation (insert or query). For a cached database the CPU overhead (cpupq) grows a lot from MySQL 5.6.51 to 8.0.31 with InnoDB. The growth is similar for MyRocks but I will skip that for now. Metrics for InnoDB/MySQL are here for 1 thread, 2 threads and 3 threads.
    • l.i0
      • cpupq grows from 19 to 29 for 1 thread
      • cpupq grows from 19 to 30 for 2 threads
      • cpupq grows from 20 to 29 for 3 threads
    • l.i1
      • cpupq grows from 42 to 63 for 1 thread
      • cpupq grows from 48 to 66 for 2 threads
      • cpupq grows from 51 to 64 for 3 threads
    • q100.1
      • cpupq grows from 194 to 347 for 1 thread
      • cpupq grows from 188 to 337 for 2 threads
      • cpupq grows from 184 to 306 for 3 threads
    Reports: QPS differences

    They also explain the difference in QPS between Postgres and MySQL for the q100.1, q500.1 and q1000.1 steps with the IO-bound setup. Using the 1 thread results for MySQL and Postgres:
    • MyRocks and Postgres don't do much IO/query (rpq, reads/query, ~= 0.02) but MyRocks uses ~4X more CPU/query (cpupq).
    • InnoDB does much IO/query (rpq ~= 4.8)
    Thus, Postgres does almost 8000 queries/s while MyRocks does ~2200/s and InnoDB is ~1000/s. But why does InnoDB do so much more IO/query. One guess is that secondary index accesses require a PK lookup to fetch the base row as explained here. The next guess is that insert buffer merges are too far behind. My final guess is that the secondary indexes are much larger for InnoDB than for MyRocks or Postgres. To rule out the first guess I might need to run a test where there are no writes in the background and InnoDB was able to catch up on purge prior to the test. One day I will explain this.

    And today is the day for me to explain why InnoDB does too much IO/query. I rules out purge because history list length was ~0. I also ruled out the change buffer after getting the same result with it enabled or disabled. The root cause is MySQL bug 109595. The optimizer + InnoDB do too many disk reads thanks to records_in_range. With the fix the InnoDB QPS for q100.1 increases from ~1000/s to ~3500/s because disk reads/query drop from ~4.5 to ~0.02.

    Reports: inserts with secondary index maintenance

    The l.i1 benchmark step measures the insert rate when there are 3 secondary indexes to maintain. The insert rate for MyRocks is similar for the cached and IO-bound workloads. That is definitely not true for InnoDB and Postgres. The reason is that non-unique secondary index maintenance is read free for MyRocks. The rpq (reads/operation) column makes this clear. It is ~0 for MyRocks, ~0.5 for InnoDB and ~1.3 for Postgres with the IO-bound workload.

    Reports: read+write and target insert rate

    Postgres was unable to sustain the target insert rate (4000/s) for the q1000.1 benchmark step with 4 threads. These benchmark steps have N threads doing queries as fast as possible and then N more threads doing rate limited writes. In this benchmark there were 3 steps with 100, 500 and then 1000 inserts/s per thread and Postgres failed to sustain 1000 inserts/s/thread when there were 4 threads.

    The root cause for this is IO efficiency where MyRocks is the most IO efficient for inserts because non-unique secondary index maintenance is read free. And then InnoDB is the next most IO efficient because the change buffer reduces IO for secondary index maintenance. Finally there is Postgres which doesn't have any IO efficiency optimizations for index maintenance.

    To understand the impact, first look at the IO/insert during l.i1 (inserts with 3 secondary indexes to maintain) using the rpq (reads/operation) and wpi (writes/insert) columns from the metrics tables for MySQL and for Postgres using the run with 1 thread.
    Note that the rpq and wpi values for MyRocks are harder to compare with a B-Tree because much of the IO is from compaction using larger requests. The InnoDB doublewrite buffer also makes this complicated. So we can also look at rkbpq and wkbpi which are read KB/insert and write KB/insert.
    The page size was 8kb for MyRocks, 16kb for InnoDB and 8kb for Postgres. The config files are here for MyRocks, InnoDB and Postgres.

    But from the above, Postgres appears to be the least IO efficient for inserts because is does ~3 IOs (rpq+wpi) per insert, while InnoDB does ~1.6 and MyRocks does something much closer to zero. The impact of being less IO efficient is that the target insert rate of 4000/s cannot be sustained for the q1000.1 benchmark step from the combination of IO latency and IO demanded/insert. Metrics for q1000.1 with 4 threads and Postgres is here. More info on the IO capacity of the Beelink servers I used for the benchmarks will arrive soon in another post.

    Graphs for the cached workload

    These graphs have results from the cached workload for all of the DBMS. They make it easy to see both the regressions in MySQL and the lack of them in Postgres.


    Graphs for the IO-bound workload

    These graphs have results from the IO-bound workload for all of the DBMS. They make it easy to see both the regressions in MySQL and the lack of them in Postgres.


    Tuesday, January 3, 2023

    RocksDB microbenchmarks: crc32c, xxh3 and lz4 uncompress

    The RocksDB benchmark took, db_bench, includes several microbenchmarks to test the performance for hash and checksum functions, compression and decompression. The microbenchmarks measure the latency for these operations per block and the typical block size for me is 4kb or 8kb. A script that I use to run these is here.

    The goal for this work is to determine whether there are compiler and other software perf bugs that can be fixed. One such bug has already been found and fixed for clang. These tests can also help me find bugs in the Makefiles used by RocksDB and opportunities to improve the compiler flags.

    Disclaimer

    • these are microbenchmarks run in a tight loop which can distort results
    • it would be great to learn that some of these problems can be fixed via compiler options

    tl;dr

    • Hopefully perf for crc32c with clang on x86 will improve once the bug fix reaches Ubuntu 22
    • Perf for xxh3 on Arm can be improved because c6i.2xl is ~2.4X to ~5X faster than c7g.2xl
    • Perf for xxh3 on Arm with gcc can be improved because clang is ~1.6X faster than gcc
    Updates:
    1. RocksDB uses xxh3 from the dev branch as of Aug, 2021 and c6i.2xl (x86) is ~1.5X faster than c7g.2xl (Graviton3) with that code. With latest code from the dev branch c6i.2xl is only ~1.14X faster -- when xxh3 at 4kb is the metric. Scroll down to Update 1 for more details.
    2. If compiling RocksDB on ARM you might want to edit CXXFLAGS and CFLAGS in Makefile (see here). That is hardwired to -march=armv8-a+crc+crypto and you might want to try -march=native or -mcpu=native. I tried all of these, while that did not change xxh3 perf the current hardwired value might not be great for modern ARM.

    Hardware

    I tested several CPUs using RocksDB compiled with gcc and clang and share a few interesting results. In all cases I used Ubuntu 22.04 with gcc 11.3.0 and clang 14.0.0. The servers tested are:

    • Intel at home
      • Intel NUC8i7beh (i7-8559u) with turbo boost disabled via BIOS
    • AMD at home
      • Beelink SER 4700u with Ryzen 7 4700u with CPU frequency boost disabled via: echo '0' > /sys/devices/system/cpu/cpufreq/boost
    • x86 on AWS
      • c6i.2xlarge with Intel Xeon Platinum 8375C CPU @ 2.90GHz with hyperthreading disabled
    • Arm on AWS
      • c7g with Graviton 3
    Benchmarks

    The script is here. I run it like: for i in 1 2 3; do bash cpu.sh > o.$i; done

    Compiler command lines:

    make DISABLE_WARNING_AS_ERROR=1 DEBUG_LEVEL=0 V=1 VERBOSE=1 -j8 static_lib db_bench

    make CC=clang CXX=clang++ DISABLE_WARNING_AS_ERROR=1 DEBUG_LEVEL=0 V=1 VERBOSE=1 -j8 static_lib db_bench


    Results: NUC

    Earlier this year a perf bug in clang was found and fixed to improve crc32c perf on x86.

    The results are here:
    • For crc32c gcc is ~1.4X faster than clang (see here and here). Perhaps the bug fixed earlier this year has yet to reach clang in Ubuntu 22.04.
    • For xxh3 clang is ~1.05X faster than gcc (see here and here)
    • For lz4 uncompress clang is 1.05X to 1.1X faster than gcc (see here and here)
    Results: Beelink

    The results are here:
    • For crc32c gcc is ~1.1X faster than clang (see here and here)
    • For xxh3 clang is ~1.15X faster than gcc (see here and here)
    Results: AWS x86

    The results are here:
    • For crc32c gcc is ~1.6X faster than clang (see here and here
    • For xxh3 gcc is ~1.2X faster than clang (see here and here)
    • For lz4 uncompress gcc is ~1.05X faster than clang (see here and here)
    Results: AWS Arm

    The results are here:
    • For xxh3 clang is ~1.6X faster than gcc (see here and here)
    Results: AWS x86 vs AWS Arm

    The results are here:
    •  For crc32c
      • For gcc c6i.2xl is ~1.4X faster than c7g.2xl (see here and here)
      • For clang c7g.2xl is ~1.2X faster than c6i.2xl (see here and here)
    • For xxh3
      • For gcc c6i.2xl is ~5X faster than c7g.2xl (see here and here)
      • For clang c6i.2xl is ~2.4X faster than c7g.2xl (see here and here)
    • For lz4 uncompress
      • For gcc c6i.2xl is ~1.05X faster than c7g.2xl (see here and here)
      • For clang c6i.2xl is ~1.01 to ~1.06 faster than c7g.2xl (see here and here)
    More AWS details

    Results are here from cat /proc/cpuinfo for c7g.2xl and c6i.2xl.

    Compiler command lines for crc32c are here. Command lines for xxh3 are the same.

    Update 1

    Mystery resolved, maybe.
    • RocksDB uses xxhash.h from the xxHash dev branch with the last update from Aug 6, 2021 per this commit which gets xxHash as of this commit.
    • Using benchHash from xxHash repo, xxh3 perf on c7g.2xl improved between release branch and latest on dev branch. Release is at version 0.8.1, last commit was from Nov 29, 2021.
    Perf for x86 hasn't changed much from 0.8.1 release branch and the latest on dev. In contrast, perf for ARM has improved a lot. The impact is that c6i.2xl (x86) was ~1.5X faster than c7g.2xl (ARM) with xxh3 for 4kb using older code (the bits in RocksDB). Now c6i.2xl (x86) is only ~1.14X faster.

    Using benchHash from xxHash repo and looking at xxh3 for 4kb (the 4th number on the line that starts with "xxh3", the number is MB/s), compiled with gcc -O3, all for c7g.2xl (ARM):
    • 14596 from release branch
    • 21705 from latest on dev branch at git hash 4ebd833a2
    • 14745 from dev branch at git hash 2c611a76f which is what RocksDB uses
    • 21863 from dev branch at git hash 620facc5 which is an ARM specific optimization from Aug, 2022. There were other diffs before and after this one that also help xxh3 on ARM. For reference, here is perf for the diff (c4359b17) immediately preceding 620facc5.
    And for c6i.2xl, x86:
    • 23119 from dev branch at latest (4ebd833a2) for c6i.2xl (x86)
    • 23167 from release branch for c6i.2xl (x86)

    Monday, January 2, 2023

    Variance in RocksDB benchmarks on cloud HW

    I ran experiments with performance regression tests on AWS servers to measure throughput variance across multiple runs of the benchmarks. I search for a setup with less QPS variance to reduce false positives during performance regression tests. 

    The goals were to determine:

    • Which instances have less variance
    • Whether there is less variance with hyperthreading enabled or disabled
    • Whether there is less variance with EBS (io2) or local SSD 

    The results were good for most of the instance types that I tried. By good I mean that the max coefficient of variance (stddev/mean) of the QPS for all benchmark steps of a given (server type, number of client threads) pair is less than 3%. Scroll down to the Which to choose section to see the list.

    Servers

    My focus was on m5d because m5d.2xl.ht1.nvme is the current setup used for automated tests. In the names I use below ht0 means hyperthreading disabled and ht1 means hyperthreading enabled.

    The servers that I tested are:

    • m5.2xl.ht0, m5.2xl.ht1
      • m5.2xlarge, 8 vcpu, 32G RAM, EBS (io2, 1T, 32K IOPs), hyperthread disabled/enabled
    • m5d.2xl.ht0.nvme, m5d.2xl.ht1.nvme
      • m5d.2xlarge, 8 vcpu, 32G RAM, local NVMe SSD (300G), hyperthread disabled/enabled
    • m5d.2xl.ht0.io2, m5d.2xl.ht1.io2
      • m5d.2xlarge, 8 vcpu, 32G RAM, EBS (io2, 1T, 32K IOPs), hyperthread disabled/enabled
    • m5d.4xl.ht0.nvme, m5d.4xl.ht1.nvme
      • m5d.4xlarge, 16 vcpu, 64G RAM, local NVMe SSD (300G), hyperthread disabled/enabled
    • m5d.4xl.ht0.io2, m5d.4xl.ht1.io2
      • m5d.4xlarge, 16 vcpu, 64G RAM, EBS(io2, 1T, 64K IOPs), hyperthread disabled/enabled
    • c6i.2xl.ht1
      • c6i.2xlarge, 8 vcpu, 16G RAM, EBS(io2, 1T, 32K IOPs), hyperthread enabled
    • c6i.4xl.ht0, c6i.4xl.ht1
      • c6i.4xlarge, 16 vcpu, 32G RAM, EBS(io2, 1T, 64K IOPs), hyperthread disabled/enabled
    • c6i.8xl.ht0, c6i.8xl.ht1
      • c6i.8xlarge, 32 vcpu, 64G RAM, EBS(io2, 2T, 64K IOPs), hyperthread disabled/enabled
    • c6i.12xl.ht0, c6i.12xl.ht1
      • c6i.12xlarge, 48 vcpu, 96G RAM, EBS(io2, 2T, 64K IOPs), hyperthread disabled/enabled

    Benchmark

    An overview of how I run RocksDB benchmarks is here. The benchmark was run 3 times per server type and I focus on QPS using standard deviation and coefficient of variance (stddev / mean).

    I used a fork of the RocksDB benchmark scripts. My fork is here and then I applied another diff to disable one of the benchmark steps to save time. My helper scripts make it easy for me to run the benchmarks with reasonable configuration options. The important things the helper scripts do are:

    • Configure the shape of the LSM tree so there will be enough levels even with a small database
    • Set max_background_jobs as a function of the number of CPU cores
    • Set the RocksDB block cache size as a function of the amount of RAM

    The benchmark was started using x3.sh like this this where $nt is the number of client threads, $cfg is the RocksDB configuration, $num_mem is the number of KV pairs for a cached workload and $num_io is the number of KV pairs for an IO-bound workload:

    CI_TESTS_ONLY=true bash x3.sh $nt no 1800 $cfg $num_mem $num_io byrx iobuf

    Rather than name the config I describe the values for max_background_jobs (mbj) and the block cache size (bc). The values per server type for nt, mbj, bc, num_mem, num_io were:

    • m5.2xl.ht0, m5.2xl.ht1
      • mbj=4, bc=24g, num_mem=40M, num_io=1B, nt=1,4
    • m5d.2xl.ht0.nvme, m5d.2xl.ht1.nvme
      • mbj=4, bc=24g, num_mem=40M, num_io=750M, nt=1,2,4
    • m5d.2xl.ht0.io2, m5d.2xl.ht1.io2
      • mbj=4, bc=24g, num_mem=40M, num_io=750M, nt=1,2,4
    • m5d.4xl.ht0.nvme, m5d.4xl.ht1.nvme
      • mbj=8, bc=52g, num_mem=40M, num_io=750M, nt=1,4,8
    • m5d.4xl.ht0.io2, m5d.4xl.ht1.io2
      • mbj=8, bc=52g, num_mem=40M, num_io=750M, nt=1,4,8
    • c6i.2xl.ht1
      • mbj=4, bc=12G, num_mem=40M, num_io=1B, nt=4
      • With num_mem=40M the database is slightly larger than memory. I should have used 20M.
    • c6i.4xl.ht0
      • mbj=4, bc=24G, num_mem=40M, num_io=1B, nt=4
    • c6i.4xl.ht1
      • mbj=8, bc=24G, num_mem=40M, num_io=2B, nt=8
    • c6i.8xl.ht0
      • mbj=8, bc=52G, num_mem=40M, num_io=2B, nt=8
    • c6i.8xl.ht1
      • mbj=8, bc=52G, num_mem=40M, num_io=2B, nt=16
    • c6i.12xl.ht0
      • mbj=8, bc=80G, num_mem=40M, num_io=2B, nt=16
    • c6i.12xl.ht1
      • mbj=8, bc=80G, num_mem=40M, num_io=3B, nt=24 

    Graphs for a cached workload

    This section has results for a cached workload, described as byrx earlier in this post. The benchmark steps are described here. The graphs show the coefficient of variance (stddev/mean) of the QPS for these benchmark steps: fillseq, readrandom, fwdrangewhilewriting, readwhilewriting and overwrite. Note that to save space the graphs use fwdrangeww and readww in place of fwdrangewhilewriting and readwhilewriting. For reasons I have yet to fully explain the range query tests (fwdrangewhilewriting here) tend to have more QPS variance regardless of hardware.

    The graph for 1 client thread is here. The worst variance occurs for m5.2xl.ht0, m5.2xl.ht1, m5d.2xl.ht0.io2 and m5d.2xl.ht1.io2.

    The graph for 2 client threads is here. The worst variance occurs for m5d.2xl.ht1.nvme and m5d.2xl.ht0.io2.

    The graph for 4 client threads is here. The worst variance occurs for m5d.2xl.ht?.nvme, m5d.2xl.ht0.io2, m5d.4xl.ht0.nvme, m5d.4xl.ht0.io2 and c6i.2xl.ht1. I wrote above that the database didn't fit in the DBMS cache for c6i.2xl.ht1 which might explain why it is an outlier.

    The graph for 8 client threads is here. The worst results occur for m5d.4xl.ht?.nvme and m5d.4xl.ht0.io2.

    The graph for 16 client threads is here. The worst results occur for c6i.12xlarge.ht0.

    Graphs for an IO-bound workload

    This section has results for an IO-bound workload, described as iobuf earlier in this post. The benchmark steps are described here. The graphs show the coefficient of variance (stddev/mean) of the QPS for these benchmark steps: fillseq, readrandom, fwdrangewhilewriting, readwhilewriting and overwrite. Note that to save space the graphs use fwdrangeww and readww in place of fwdrangewhilewriting and readwhilewriting.

    The graph for 1 client thread is here. The worst results occur for m5d.2xl.ht0.nvme, m5d.2xl.ht0.io2 and m5d.4xl.*.

    The graph for 2 client threads is here. The worst results occur for m5d.2xl.ht0.nvme.

    The graph for 4 client threads is here. The worst results occur for m5.2xl.ht1, m5d.2xl.*.nvme, m5d.4xl.ht0.io2 and c6i.2xl.ht1.

    The graph for 8 client threads is here. The worst results occur for m5d.4xl.ht0.io2 and c6i.4xl.ht1.

    The graph for 16 client threads is here. The worst results occur for c6i.8xlarge.ht1.

    Which to choose?

    Which setup (server type + number of client threads) should be used to minimize variance? The tables below list the maximum and average coefficient of variance from all tests for a given setup where dop=X is the number of client threads. I will wave my hands and claim a good result is a max coefficient of variance that is <= .03 (.03 = 3%).

    These setups have good results for both cached (byrx) and IO-bound (iobuf) workloads:

    • m5d.2xl.ht0.nvme - dop=1,2
    • m5d.2xl.ht1.nvme - dop=1
    • m5d.2xl.ht1.io2 - dop=2,4
    • m5d.4xl.ht0.nvme - dop=1,4,8
    • m5d.4xl.ht1.nvme - dop=4,8
    • m5d.4xl.ht0.io2 - dop=1,4,8
    • m5d.4xl.ht1.io2 - dop=4,8
    • c6i.4xl.ht0 - dop=4
    • c6i.4xl.ht1 - dop=8
    • c6i.8xl.ht0 - dop=8
    • c6i.8xl.ht1 - dop=16
    • c6i.12xl.ht0 - dop=16
    These are results for byrx (database is cached by RocksDB). 

    Max coefficient of variance
    dop=1dop=2dop=4dop=8dop=16
    m5.2xl.ht00.1490.010
    m5.2xl.ht10.0500.028
    m5d.2xl.ht0.nvme0.0130.0210.031
    m5d.2xl.ht1.nvme0.0140.0660.043
    m5d.2xl.ht0.io20.0870.0480.039
    m5d.2xl.ht1.io20.0750.0160.014
    m5d.4xl.ht0.nvme0.0270.0280.026
    m5d.4xl.ht1.nvme0.0380.0170.019
    m5d.4xl.ht0.io20.0130.0280.018
    m5d.4xl.ht1.io20.0390.0090.015
    c6i.2xl.ht10.115
    c6i.4xl.ht00.021
    c6i.4xl.ht10.008
    c6i.8xl.ht00.013
    c6i.8xl.ht10.007
    c6i.12xl.ht00.007

    These are results for iobuf (database is larger than memory).

    Max coefficient of variance
    dop=1dop=2dop=4dop=8dop=16
    m5.2xl.ht00.0050.006
    m5.2xl.ht10.0070.014
    m5d.2xl.ht0.nvme0.0250.0270.016
    m5d.2xl.ht1.nvme0.0050.0110.030
    m5d.2xl.ht0.io20.0080.0080.010
    m5d.2xl.ht1.io20.0050.0080.004
    m5d.4xl.ht0.nvme0.0110.0100.007
    m5d.4xl.ht1.nvme0.0100.0080.004
    m5d.4xl.ht0.io20.0110.0280.013
    m5d.4xl.ht1.io20.0110.0110.004
    c6i.2xl.ht10.042
    c6i.4xl.ht00.007
    c6i.4xl.ht10.012
    c6i.8xl.ht00.010
    c6i.8xl.ht10.017
    c6i.12xl.ht00.007

    Performance summaries

    In the linked URLs below: byrx means cached by RocksDB and iobuf means IO-bound with buffered IO. The links are to the performance summaries generated by the benchmark scripts.

    Results for dop=1

    Results for dop=2
    Results for dop=4
    Results for dop=8
    Results for dop=16
    Results for dop=24