This has results for in-memory sysbench on a c2-standard-60 server in GCP to determine whether there are CPU performance regressions from old MyRocks (5.6.35) to modern MyRocks (8.0.28). Results for MyRocks and sysbench on a small server are here. The context for the results is short-running queries, in-memory (cached by MyRocks) with high-concurrency (20 clients) on a big server (30-cores).
There are two goals from these benchmarks. The first goal is to determine whether there are CPU regressions (more CPU/query) from old versions to new versions. The second goal is to determine which compiler optimizations I should use when building MyRocks from source.
tl;dr
- For MyRocks 5.6.35 the rel build has the best performance
- For MyRocks 8.0.28 the rel_native_lto build has the best performance. The largest improvement is from link time optimization.
- For the 5.6.35 vs 8.0.28 comparison only the write benchmarks show a regression in 8.0.28, for point queries 5.6.35 and 8.0.28 have similar throughput and for range queries 8.0.28 gets about 20% more throughput. The results here for 8.0.28 are much better than the results on the small server. Perhaps the extra CPU in 8.0.28 is offset by less mutex contention.
Range queries in 5.6.35 vs 8.0.28
Why are the range query microbenchmarks ~20% faster in 8.0.28? My first guess is that 8.0.28 used the hyper clock cache, but it used LRUCache just like 5.6.35. Then I looked at vmstat output for range-covered-pk.range100 where 8.0.28 gets ~32% more QPS: 108204 for 8.0.28 vs 82209 for 5.6.35. From vmstat I see that average values for user and system CPU (the us and sy columns) are (50, 17) for 5.6.35 and (59, 10) for 8.0.28 where (A, B) is (user, system). A larger ratio for system time implies there is more mutex contention.
Some of the difference is due the usage of link-time optimization for 8.0.28 but not for 5.6.35 because I wasn't willing to invest a few hours in figuring out how to build 5.6 with -flto.
Some of the difference is due the usage of link-time optimization for 8.0.28 but not for 5.6.35 because I wasn't willing to invest a few hours in figuring out how to build 5.6 with -flto.
Benchmark
A description of how I run sysbench is here. Tests use the a c2-standard-60 server on GCP (30 cores with hyperthreading disabled, 240G RAM, 3T of storage (XFS, SW RAID 0 striped over 8 NVMe devices). The sysbench tests were run for 20 clients and 600 seconds per microbenchmark using 4 tables with 50M rows per table. All tests use the MyRocks storage engine. The test database fits in the MyRocks buffer pool.
Builds
I tested MyRocks in FB MySQL versions 5.6.35 and 8.0.28 using multiple builds for each version. For each build+version the full set of sysbench microbenchmarks was repeated.
Compiler options tested by the builds include:
Compiler options tested by the builds include:
- -O2 vs -O3
- link time optimization via -flto
- CPU specific tuning via -march=native -mtune=native
- CMAKE_BUILD_TYPE set to RelWithDebInfo vs Release (see here)
The builds are fully described in the previous post.
For MyRocks 5.6.35 I tested these builds: rel, rel_o2, rel_withdbg.
For MyRocks 8.0.28 I tested these builds: rel_withdbg, rel_o2, rel_native, rel, rel_o2_lto, rel_native_lto, rel_lto.
Results: per-version
The result spreadsheet is here.
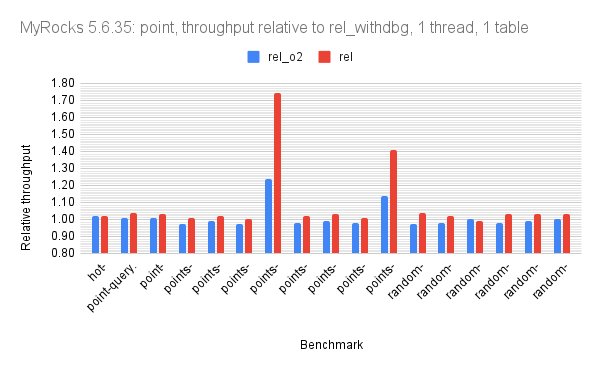
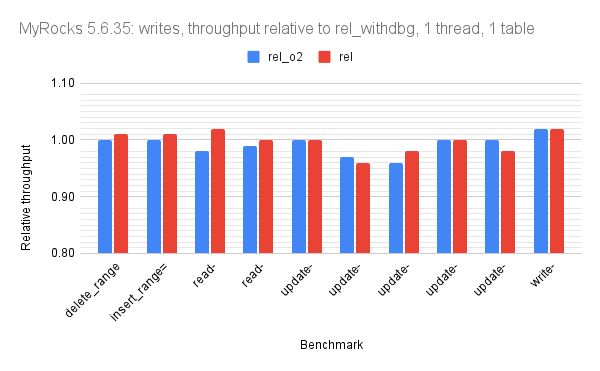
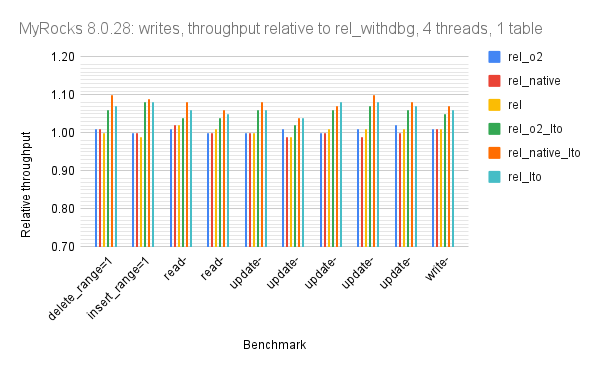
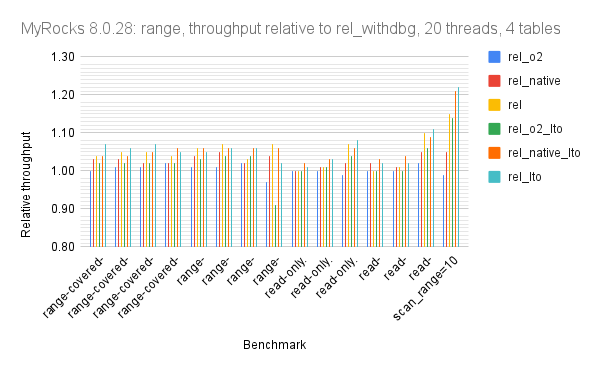
The graphs use relative throughput which is throughput for me / throughput for base case. When the relative throughput is > 1 then my results are better than the base case. When it is 1.10 then my results are ~10% better than the base case. The base case is the rel_withdbg build for 5.6.35 and 8.0.28.
There are three graphs per version which group the microbenchmarks by the dominant operation: one for point queries, one for range queries, one for writes.
Disclaimers:
- Readability is much better via the spreadsheet so I did not make the graphs x-large here.
- For most of the graphs the axis with values doesn't start at 0 to improve readability
For MyRocks 5.6.35 the throughput median for the rel build relative to rel_withdbg is 1.02 for point, 1.04 for range, 1.03 for writes.


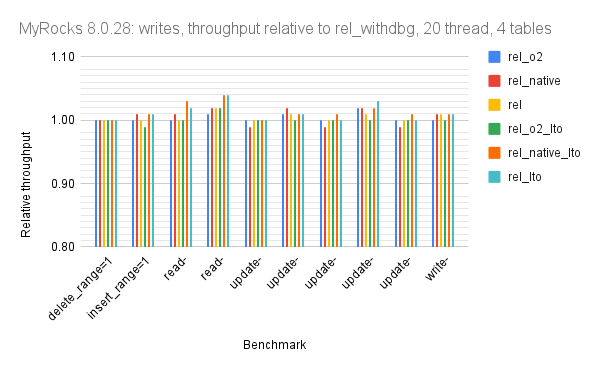
For MyRocks 8.0.28 the throughput median for the rel_native_lto build relative to rel_withdbg is 1.06 for point, 1.06 for range, 1.01 for writes.

Results: all versions
These have results for MyRocks versions 5.6.35 and 8.0.28 on one graph using the rel build for 5.6.35 and the rel_native_lto build for 8.0.28. The result spreadsheet is here.
The graphs use relative throughput which is throughput for me / throughput for base case. When the relative throughput is > 1 then my results are better than the base case. When it is 1.10 then my results are ~10% better than the base case. The base case is the rel build with MyRocks 5.6.35.
There are three graphs per version which group the microbenchmarks by the dominant operation: one for point queries, one for range queries, one for writes.
The throughput median for the rel_native_lto 8.0.28 build relative to the 5.6.35 rel is 1.02 for point, 1.23 for range, 0.97 for writes. The results here (few regressions) are much better than the results on the small server. Perhaps mutex contention was greatly reduced to counter the increase in CPU/query.


Summary statistics
These are computed for the throughput relative to the rel_withdbg build.
For MyRocks 5.6.35
For MyRocks 8.0.28
For MyRocks 8.0.28 with the rel_native_lto build relative to MyRocks 5.6.35 with the rel build