I used sysbench to search for performance regressions from old Postgres (11.19) to modern Postgres (15.2) and to determine the impact of compiler optimizations because I build it from source. The context for the results is short-running queries, in-memory (cached by Postgres) with low-concurrency (1 & 4 clients) on a small server (8-core AMD).
tl;dr
- Small improvements are more common than small regressions but on average the CPU/query overhead has not changed from 11.19 to 15.2 which is great news.
- Modern Postgres (version 15.x) does slightly better relative to version 11.19 on the 4-thread tests than on the 1-thread tests.
- Two microbenchmarks have large improvements in modern Postgres relative to version 11.19 -- full table scan and an update-only workload that updates only one row out of 20M
- The o3_native_lto build has the best performance with 5% to 10% more QPS than the def build. This is a result I have repeated elsewhere -- the o3_native_lto build benefits a little bit from -O3 and CPU specific optimizations, but mostly from link time optimization
Benchmark
A description of how I run sysbench is here. Tests use the Beelink server (8-core AMD, 16G RAM, NVMe SSD). The sysbench tests were run for 600 seconds per microbenchmark using 1 table with 20M rows. The test database fits in the Postgres buffer pool. The benchmark was repeated for 1 and 4 clients.
The conf.diff.cx7 (x7) Postgres configuration was used which is here for version 12, version 13, version 14 and version 15. For Postgres version 11 I used the version 12 config.
Builds
I tested Postgres versions 11.19, 12.14, 13.10, 14.7, 15.1 and 15.2 using multiple builds for each version. For each build+version the full set of sysbench microbenchmarks was repeated.
For version 15.1 I tested these builds. The command line for configure, output from configure and output from make is here. This sequence of builds helps to distinguish between the impact from -O3, CPU specific optimizations (-march, -mtune) and link time optimization. Results below show that most of the benefit comes from link time optimization.
- def - uses -O2
- o2_nofp - uses -O2 -fno-omit-frame-pointer
- o3 - uses -O3
- o3_native - uses -O3 -march=native -mtune=native
- o3_native_lto - uses -O3 -march=native -mtune=native -flto, -flto enables link time optimization
For versions 11.19, 12.14, 13.10, 14.7 and 15.2 I tested these builds. The command line for configure, output from configure and output from make is here for 11.19, 12.14, 13.10, 14.7 and 15.2.
- def - uses -O2
- o3_native - uses -O3 -march=native -mtune=native
- o3_native_lto - uses -O3 -march=native -mtune=native -flto, -flto enables link time optimization
Results: 1 thread, per-version
The result spreadsheet is here for 1-thread and for 4-threads.
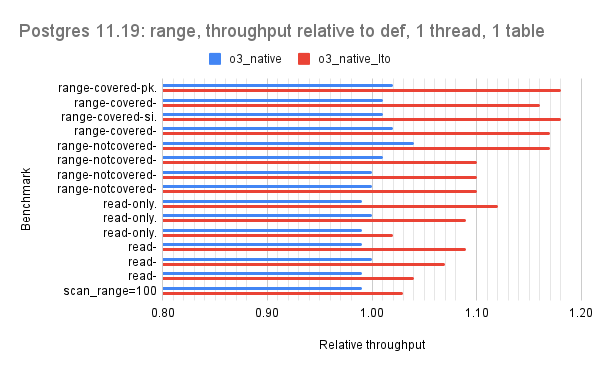
The graphs use relative throughput which is throughput for me / throughput for base case. When the relative throughput is > 1 then my results are better than the base case. When it is 1.10 then my results are ~10% better than the base case. For all versions the base case is the def build that uses -O2.
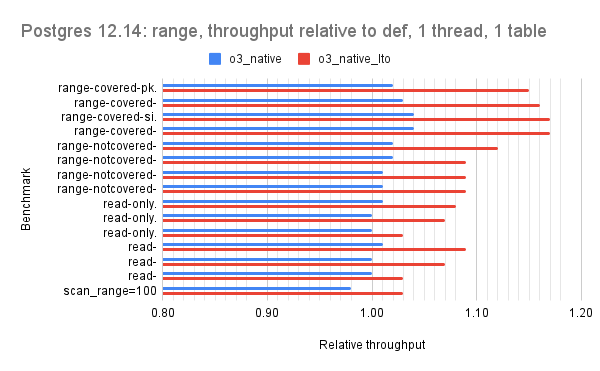
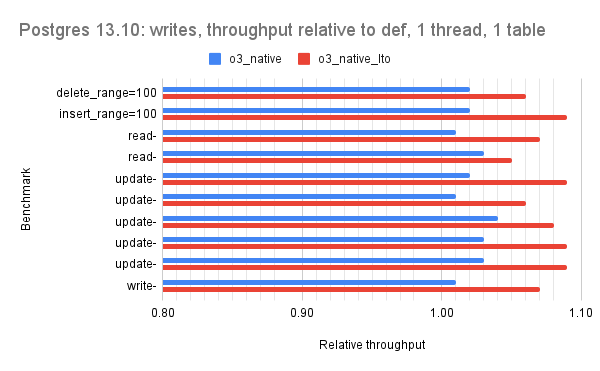
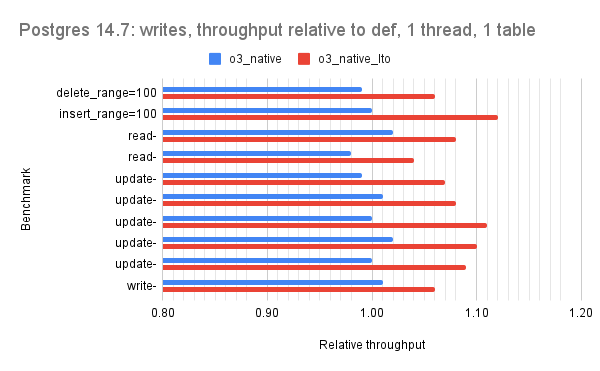
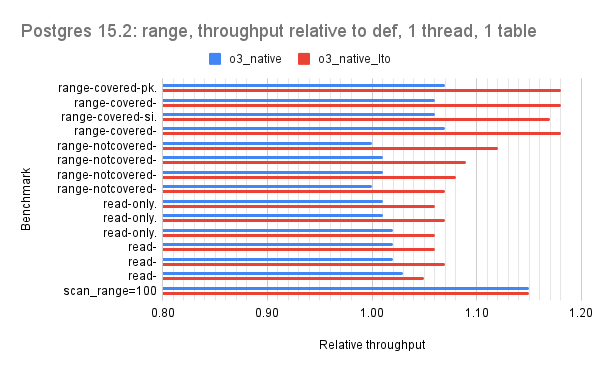
For all but version 15.1 there are 2 bars per microbenchmark and the red bar is the interesting one (o3_native_lto). There are three graphs per Postgres version which group the microbenchmarks by the dominant operation: one for point queries, one for range queries, one for writes.
For the point query microbenchmarks the hot-points test benefits the most from the o3_native_lto build. For range queries, the o3_native_lto build has the largest benefit for the first four microbenchmarks (range-covered-pk.* & range-covered-si.*).
Disclaimers:
- Readability is much better via the spreadsheet so I did not make the graphs x-large here.
- For most of the graphs the axis with values doesn't start at 0 to improve readability
For version 11.19 the relative throughput median for o3_native_lto is 1.05 for point, 1.10 for range, 1.07 for writes.


For version 12.14 the relative throughput median for o3_native_lto is 1.07 for point, 1.09 for range, 1.06 for writes.


For version 13.10 the relative throughput median for o3_native_lto is 1.06 for point, 1.09 for range, 1.08 for writes.


For version 14.7 the relative throughput median for o3_native_lto is 1.08 for point, 1.10 for range, 1.08 for writes.


For version 15.1 the relative throughput median for o3_native_lto is 1.08 for point, 1.12 for range, 1.09 for writes. The graphs for 15.1 have more data (more builds were tested) so I swapped the x and y axis. The green bar has results for o3_native_lto, which again is the best build.
The results here show that most of the benefit from o3_native_lto comes from lto (link time optimization) and not from o3 (-O3) nor from native (-march=native -mtune=native).


For version 15.2 the relative throughput median for o3_native_lto is 1.08 for point, 1.08 for range, 1.09 for writes.


Results: 1 thread, all versions
These have relative throughput for Postgres versions 12.14, 13.10, 14.7, 15.1 and 15.2. The base case is version 11.19 and all used the o3_native_lto build. There are two outliers for which throughput is much better in modern Postgres -- full table scan (scan_range=100) starting in 14.7 and update the same row (update-one_range=100) starting in 12.14.
For point queries the median relative throughput is 1.01 for version 15.2 versus version 11.19. There are small improvements for many of the point query workloads in modern Postgres .
For range queries the median relative throughput for version 15.2 is 1.00 versus version 11.19. There were improvements to relative throughput in versions 12 and 13 but those are going away in modern Postgres.
For range queries the median relative throughput for version 15.2 is 1.00 versus version 11.19. There were improvements to relative throughput in versions 12 and 13 but those are going away in modern Postgres.
For writes the median relative throughput for version 15.2 is 0.99 versions version 11.19.


Summary statistics: 1 thread, all versions
Summary statistics of the relative throughput values for versions 12.14, 13.10, 14.7. 15.1 and 15.2 relative to version 11.19 are below. These are grouped by workload type: point, range and writes. All use the results from the o3_native_lto build.
Summary:
- Excluding the outliers there aren't CPU regressions from old (11.19) to modern (15.2) Postgres which is great news.
- The outliers are two microbenchmarks for which modern Postgres does much better than old Postgres -- scan_range=100 starting in version 14.7 which does full table scan, update-one_range=100 starting in 12.14 which does updates to the same row (out of 20M rows)
Summary statistics: 4 threads, all versions
To save space I won't show the graphs for the benchmarks repeated with 4 threads but they were similar to the 1-thread results. I will share the summary statistics for the o3_native_lto builds across all versions (11.19, 12.14, 13.10, 14.7, 15.1. 15.2).
The result spreadsheet is here for 1-thread and for 4-threads.
The average and median relative throughput here is slightly better than for the 1-thread results above.
No comments:
Post a Comment