This has results for in-memory sysbench on a c2-standard-60 server in GCP to determine whether there are CPU performance regressions from old Postgres (version 11) to modern Postgres (version 15). This is the second post from my current round of tests with Postgres, the previous post is here.
There are two goals from these benchmarks. The first goal is to determine whether there are CPU regressions (more CPU/query) from old versions to new versions. The second goal is to determine which compiler optimizations I should use when building Postgres from source.
Update - I don't trust these results because I mis-configured huge pages by setting vm.nr_hugepages to a too-large value. The more truthy results are here. The c2-standard-60 server has 240G of RAM, the huge page size is 2M and I initially set vm.nr_hugepages to 108000. That requires 210G of RAM which didn't leave enough for others.
tl;dr
- The o3_native_lto build has the best performance but the improvement is usually between 1% and 5% which is smaller than the improvements from the small server test. That is a reasonable result because a test here with more concurrency can also suffer from more mutex contention. Regardless, link time optimization seems like a nice improvement.
- There aren't CPU regressions from version 11 to version 15 for the point and range query microbenchmarks.
- There are significant improvements for write throughput from version 11 to version 15 as the median improvement for write microbenchmarks is larger than 1.5X. I assume this is from architectural improvements.
HardwareThe c2-standard-60 server has 30 cores (hyperthreading disabled), 240G RAM. The storage is SW RAID 0 across 8 local NVMe devices with XFS. The database is cached by Postgres so there are no reads from storage.
Benchmark
A description of how I run sysbench
is here. The sysbench microbenchmarks were run for 20 clients, 600 seconds per microbenchmark using 4 table with 50M rows per table. The test database fits in the Postgres buffer pool.
Builds
I tested Postgres versions 11.19, 12.14, 13.10, 14.7, 15.1 and 15.2 using multiple builds for each version. For each build+version the full set of sysbench microbenchmarks was repeated.
For version 15.1 I tested these builds. The command line for configure, output from configure and output from make
is here for the builds I did on my home Beelink servers. This sequence of builds helps to distinguish between the impact from -O3, CPU specific optimizations (-march, -mtune) and link time optimization. Results below show that most of the benefit comes from link time optimization.
- def - uses -O2
- o2_nofp - uses -O2 -fno-omit-frame-pointer
- o3 - uses -O3
- o3_native - uses -O3 -march=native -mtune=native
- o3_native_lto - uses -O3 -march=native -mtune=native -flto, -flto enables link time optimization
For versions 11.19, 12.14, 13.10, 14.7 and 15.2 I tested these builds. The command line for configure, output from configure and output from make is here for
11.19,
12.14,
13.10,
14.7 and
15.2 -- from the builds I did on my home Beelink servers. I have yet to publish the make/configure output for the GCP builds.
- def - uses -O2
- o3_native_lto - uses -O3 -march=native -mtune=native -flto, -flto enables link time optimization
Results: per-version
The graphs use relative throughput which is throughput for me / throughput for base case. When the relative throughput is > 1 then my results are better than the base case. When it is 1.10 then my results are ~10% better than the base case. For all versions the base case is the def build that uses -O2.
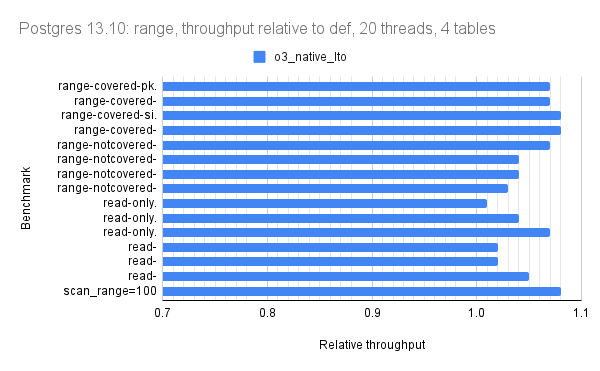
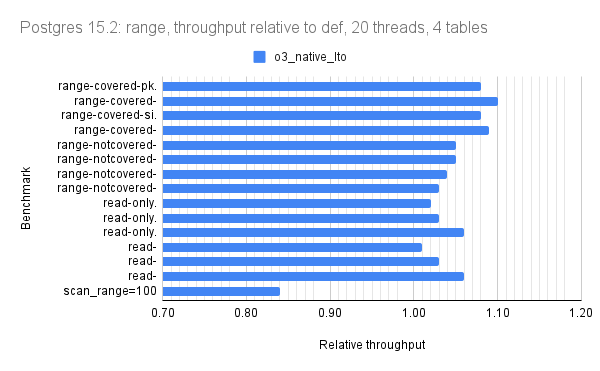
For all but version 15.1 there is 1 bar per microbenchmark (throughput for o3_native_lto). There are three graphs per Postgres version: one for point queries, one for range queries, one for writes.
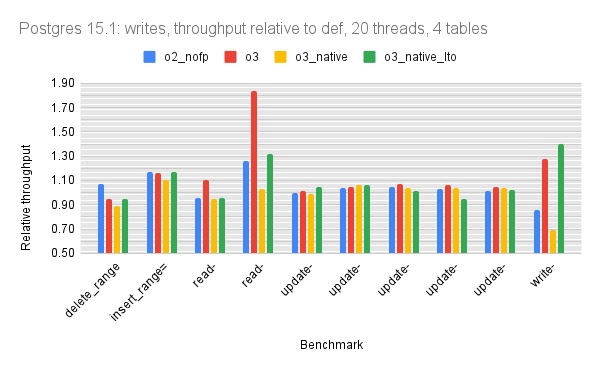
The write microbenchmarks have a lot of variance. I didn't investigate it and will ignore the issue for now to focus on the point and range microbenchmarks.
Disclaimers:
- Readability is much better via the spreadsheet so I did not make the graphs x-large here.
- For most of the graphs the axis with values doesn't start at 0 to improve readability
For version 11.19 the relative throughput median for o3_native_lto is 1.03 for point, 1.05 for range, 1.00 for writes.


For version 12.14 the relative throughput median for o3_native_lto is 1.04 for point, 1.03 for range, 0.95 for writes.
For version 13.10 the relative throughput median for o3_native_lto is 1.03 for point, 1.05 for range, 1.04 for writes.
For version 14.7 the relative throughput median for o3_native_lto is 1.03 for point, 1.05 for range, 0.99 for writes.
For version 15.1 the relative throughput median for o3_native_lto is 1.04 for point, 1.04 for range, 1.04 for writes. The graphs for 15.1 have more data (more builds were tested) so I swapped the x and y axis. The green bar has results for o3_native_lto, which again is the best build.
The results here show that most of the benefit from o3_native_lto comes from lto (link time optimization) and not from o3 (-O3) nor from native (-march=native -mtune=native).
For version 15.2 the relative throughput median for o3_native_lto is 1.04 for point, 1.05 for range, 1.01 for writes.
Results: all versions
These have relative throughput for Postgres versions 12.14, 13.10, 14.7, 15.1 and 15.2. The base case is version 11.19 and all used the o3_native_lto build. For version 15.2 the relative throughput median for o3_native_lto (relative to 11.19) is 1.01 for point, 1.00 for range, 1.65 for writes.
Summary statistics: all versions
Summary statistics of the relative throughput values for versions 12.14, 13.10, 14.7. 15.1 and 15.2 relative to version 11.19 are below. These are grouped by workload type: point, range and writes. All use the results from the o3_native_lto build.
Summary:
- My small server tests showed two microbenchmarks (scan, update-one_range=100) for which Postgres version 15 did much better than 11.19. Those results do not reproduce here. But note that the scan test here only uses 4 clients (one per table).
- The relative throughput for writes is much better here in versions 14.7, 15.1 and 15.2 relative to 11.19. This does not reproduce in the small servers tests.
- The write benchmarks have a lot of variance and I have yet to explain that. It could be a result of checkpoints and write-heavy tests that only run for 10 minutes.
- Otherwise results are great in that there aren't regressions in from version 11.19 to version 15 -- so the community has done a great job in avoiding CPU regressions.
| 11.19 | 12.14 | 13.10 | 14.7 | 15.1 | 15.2 |
| Point: avg | 1.00 | 1.00 | 1.01 | 1.01 | 1.01 |
| Point: median | 1.00 | 1.00 | 1.01 | 1.01 | 1.01 |
| Point: min | 0.96 | 0.98 | 0.97 | 0.95 | 0.94 |
| Point: max | 1.03 | 1.03 | 1.03 | 1.03 | 1.03 |
| Point: stddev | 0.014 | 0.013 | 0.015 | 0.019 | 0.021 |
| | | | | |
| Range: avg | 0.98 | 0.99 | 0.98 | 1.01 | 1.00 |
| Range: median | 0.99 | 1.01 | 0.99 | 1.00 | 1.00 |
| Range: min | 0.85 | 0.83 | 0.87 | 0.96 | 0.89 |
| Range: max | 1.02 | 1.03 | 1.01 | 1.13 | 1.12 |
| Range: stddev | 0.039 | 0.048 | 0.036 | 0.040 | 0.049 |
| | | | | |
| Write: avg | 1.11 | 1.03 | 1.59 | 1.67 | 1.68 |
| Write: median | 1.02 | 1.05 | 1.54 | 1.69 | 1.65 |
| Write: min | 0.80 | 0.55 | 0.77 | 0.85 | 0.84 |
| Write: max | 1.63 | 1.62 | 2.42 | 3.15 | 3.24 |
| Write: stddev | 0.283 | 0.346 | 0.593 | 0.702 | 0.718 |


No comments:
Post a Comment