I used sysbench to test MySQL/InnoDB performance on a big server. This is similar to the results I shared for InnoDB vs sysbench on a small server. The context for the results is short-running queries, in-memory (cached by InnoDB) with high-concurrency (20 clients) on a big server (30-cores). The goals are:
- Understand the impact of compiler optimizations
- Document how performance has changed from MySQL 5.6 to 5.7 to 8.0
tl;dr
- The rel_lto build gets 4%, 0% and 3% more QPS for point query, range query and write microbenchmarks compared to the rel_withdbg build for MySQL 8.0.31. This is similar to the benefit measured on the small server. Link-time optimization is nice.
- 8.0 releases look much better here with a big server & high-concurrency than on the small server with low-concurrency.
- For changes from 5.6 to 8.0
- Point queries - version 8.0.32 gets about 4% more QPS (on average) versus version 5.6.51. But microbenchmarks that use the PK index do better than average while ones that use the secondary index do much worse than average where much worse means getting about 25% less QPS than 5.6.51.
- Range queries - version 8.0.32 gets about 22% less QPS versus version 5.6.51. The regressions have been gradual from 5.6 to 5.7 to 8.0.
- Writes - version 8.0.32 gets almost 3X more QPS versus version 5.6.51. All of that improvement is between 5.6.51 and 5.7.40.
Benchmark
A description of how I run sysbench is here. Tests use the a c2-standard-60 server on GCP with 30-cores, hyperthreading disabled, 240G RAM and 3TB of local attached NVMe. The sysbench tests were run for 20 clients, 600 seconds per microbenchmark using 4 tables with 50M rows per table. All tests use the InnoDB storage engine. The test database fits in the InnoDB buffer pool.
Builds
I tested MySQL versions 5.6.51, 5.7.40, 8.0.22, 8.0.28, 8.0.31 and 8.0.32 using multiple builds for each version. For each build+version the full set of sysbench microbenchmarks was repeated. More details on the builds are in the previous post. To save time I only tested all builds for 8.0.31 and for other versions used the rel_lto build.
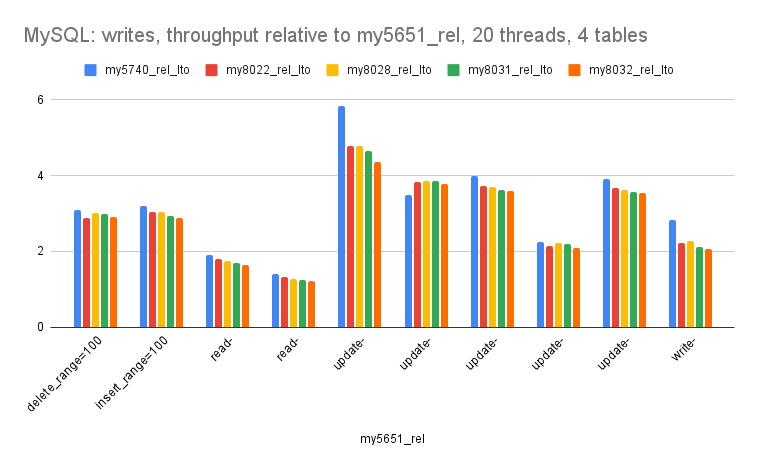
Results: all versions
The spreadsheet is here. See the 56_to_80.redo tab.
The graphs use relative throughput which is throughput for me / throughput for base case. When the relative throughput is > 1 then my results are better than the base case. When it is 1.10 then my results are ~10% better than the base case. The base case here is MySQL 5.6.51 using the rel_lto build.
There are three graphs per version which group the microbenchmarks by the dominant operation: one for point queries, one for range queries, one for writes. There is much variance within each of the microbenchmark groups:
- Point queries - most of the regressions, where the relative throughput is much less than 1, occur on microbenchmarks that use the secondary index. See the spreadsheet for the full microbenchmark names as they are cutoff on the graphs below. So on average 8.0.32 gets about 4% more QPS than 5.6.51 but that can hide something. For microbenchmarks that use the PK index the QPS from 8.0.32 is usually much more than 4% better than 5.6.51. For microbenchmarks that use the secondary index the QPS from 8.0.32 is usually about 25% less than 5.6.51.
- Range queries - results are in three classes.
- The first class gets about 22% less QPS versus 5.6.51. These do a variety of range scans using the PK or secondary index. For some the index is covering, for others it is not.
- The second class gets about 12% more QPS versus 5.6.51. The Lua script for all of these is oltp_read_only.lua which is the classic sysbench transaction excluding writes.
- The final class has but one microbenchmark that does a full table scan (scan_range*) and 5.6.51 will soon be 2X faster than modern MySQL for that microbenchmark.
- Writes - while there is much variance in the relative throughput across the microbenchmarks in this group, in all cases the throughput with 8.0 is much better than 5.6.51. The read-write* microbenchmarks have the least improvement in 8.0 versus 5.6.51 but those use oltp_read_write.lua which is the classic sysbench transaction and that includes range queries in addition to the writes.


Summary statistics:
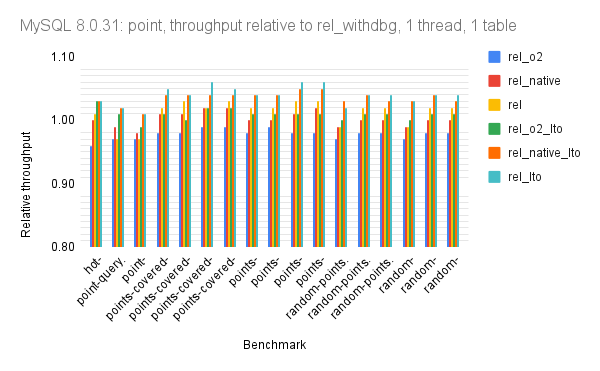
Results: version 8.0.31
The spreadsheet is here. See the my8031.redo tab.
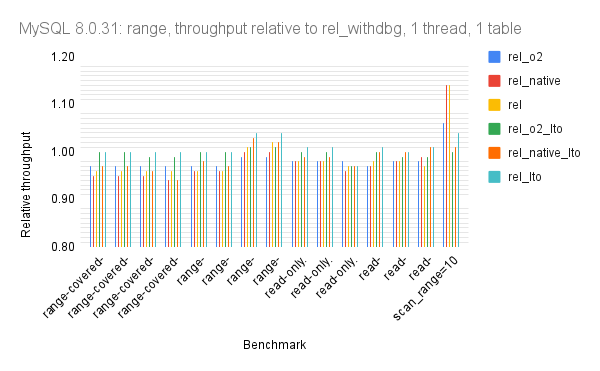
The graphs use relative throughput which is throughput for me / throughput for base case. When the relative throughput is > 1 then my results are better than the base case. When it is 1.10 then my results are ~10% better than the base case. The base case here is MySQL 8.0.31 using the rel_withdbg build.
There are three graphs per version which group the microbenchmarks by the dominant operation: one for point queries, one for range queries, one for writes. For each group of microbenchmarks:
- point queries show little variance
- range queries show little variance except on the full scan (scan_range=10). I suspect that is noise from the microbenchmark rather than from compiler optimizations
- writes show little variance

Summary statistics:
Thanks for sharing so much detail. Do you know what the CPU platform of the c2-standard-60 node is? My understanding is it can be Ice Lake or Cascade Lake....
ReplyDeleteI need to update my scripts to archive /proc/cpuinfo contents. Fortuately I still have the server and it is:
Deleteprocessor : 29
vendor_id : GenuineIntel
cpu family : 6
model : 85
model name : Intel(R) Xeon(R) CPU @ 3.10GHz
stepping : 7
microcode : 0xffffffff
cpu MHz : 3100.324
cache size : 25344 KB
physical id : 1
siblings : 15
core id : 14
cpu cores : 15
apicid : 60
initial apicid : 60
fpu : yes
fpu_exception : yes
cpuid level : 13
wp : yes
flags : fpu vme de pse tsc msr pae mce cx8 apic sep mtrr pge mca cmov pat pse36 clflush mmx fxsr sse sse2 ss ht syscall nx pdpe1gb rdtscp lm constant_tsc rep_good nopl xtopology nonstop_tsc cpuid tsc_known_freq pni pclmulqdq monitor ssse3 fma cx16 pcid sse4_1 sse4_2 x2apic movbe popcnt aes xsave avx f16c rdrand hypervisor lahf_lm abm 3dnowprefetch invpcid_single ssbd ibrs ibpb stibp ibrs_enhanced fsgsbase tsc_adjust bmi1 hle avx2 smep bmi2 erms invpcid rtm mpx avx512f avx512dq rdseed adx smap clflushopt clwb avx512cd avx512bw avx512vl xsaveopt xsavec xgetbv1 xsaves arat avx512_vnni md_clear arch_capabilities
bugs : spectre_v1 spectre_v2 spec_store_bypass mds swapgs taa mmio_stale_data retbleed eibrs_pbrsb
bogomips : 6200.64
clflush size : 64
cache_alignment : 64
address sizes : 46 bits physical, 48 bits virtual
power management: