This compares InnoDB and MyRocks via sysbench using a cached database and (mostly) short-running queries. The goal is to understand the difference in CPU/query overheads between the storage engines.
One of my pet peeves is a statement about operation costs (reads are faster/slower, writes are faster/slower with an LSM) without distinguishing between the CPU and IO overheads. With an LSM you will usually spend more CPU on reads but you are unlikely to spend more IO on reads -- versus a B-Tree.
tl;dr
- Note the context, MyRocks will look much better with an IO-bound workload. But the database here is cached by the storage engine. Based on the median of the relative throughput values per microbenchmark group (point, range, writes)
- For MySQL 5.6, MyRocks gets ~60%, ~50% and ~52% of the QPS versus InnoDB for point query, range query and writes. There was one exception -- InnoDB suffers on high-concurrency writes.
- For MySQL 8.0, MyRocks gets ~70%, ~60%, ~70% of the QPS versus InnoDB for point query, range, query and writes. There was one exception -- high-concurrency writes.
- MyRocks does worse versus InnoDB when compared using MySQL 5.6 than 8.0
- MyRocks does worse relative to InnoDB for range queries than for point and this is expected
- InnoDB in 8.0 is much more efficient for writes versus InnoDB in 5.6
- MyRocks does much better than InnoDB (with one exception) on the update-index microbenchmark because non-unique secondary index maintenance is read free (see here)
My usage of sysbench is explained here. Tests were run on a large and small server.
I used MyRocks from FB MySQL 5.6.35 and 8.0.28 and InnoDB from upstream MySQL 5.6.51 and 8.0.28. MySQL was compiled from source and I used the rel build for MySQL 5.6. rel_native_lto for MyRocks 8.0.28 and rel_lto for InnoDB 8.0.28. For notes on the builds see here and here.
The small server is a Beelink with 16G RAM, 8 AMD cores and NVMe storage (see here). I ran sysbench with 1 table and 20M rows using both 1 and 4 clients. The config files for MyRocks were ay9c for 5.6.35 and 8.0.28. The config files for InnoDB were y8 for 5.6.51 and y9 for 8.0.28.
The large server is a c2-standard-60 from GCP with 30 cores (hyperthreading disabled), 240G RAM and a few TB of local NVMe. I ran sysbench with 4 tables and 50M rows/table using 20 clients. Huge pages were enabled for InnoDB on the large server. The config files for MyRocks were y9c_gcp_c2s60 for 5.6.35 and 8.0.28. The config files for InnoDB were y10_gcp_c2s60 for 5.6.51 and 8.0.28. I have yet to try the hyper clock cache for MyRocks. That should improve results at high-concurrency.
The database is cached by MyRocks and InnoDB on the large and small server. Sysbench was run for 10 minutes per microbenchmark and there were 42 microbenchmarks. The microbenchmarks are put into three groups based on the dominant operation - point query, range query, writes. Graphs and summary statistics are provided per group.
Summary statistics
Summary statistics are provided for each group of microbenchmarks (point, range, writes) and are computed over the relative throughput. The relative throughput is (QPS for MyRocks / QPS for InnoDB) using either results from MySQL 5.6 or 8.0. I highlighted the median values in the tables below because I prefer them over the average.
All of the results are in the spreadsheet here.
Results from MyRocks 5.6.35 relative to InnoDB 5.6.51.
- InnoDB does much better than MyRocks except for the write microbenchmarks at 20 clients where InnoDB suffers from mutex contention (fixed by 8.0, see below).
- MyRocks does much worse on range queries at high-concurrency than at low
Results from MyRocks 8.0.28 relative to InnoDB 8.0.28.
- InnoDB does much better at the write microbenchmarks here than in 5.6.51 above.
- MyRocks does slightly worse on range queries at high-concurrency than at low
- MyRocks does much worse on writes at high-concurrency than at low
Results: 1 thread
This section has results from the Beelink (small server) with 1 client.
The graphs use relative throughput which is throughput for me / throughput for base case. When the relative throughput is > 1 then my results are better than the base case. When it is 1.10 then my results are ~10% better than the base case. The base case is InnoDB from upstream MySQL.
All of the results are in the spreadsheet here.
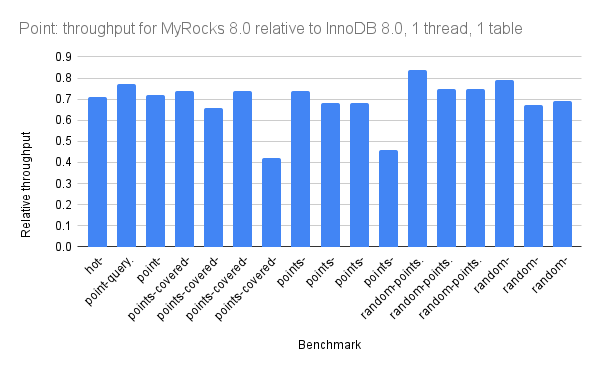
For point queries:

For range queries:


For writes:


This section has results from the Beelink (small server) with 4 clients.
The graphs use relative throughput which is throughput for me / throughput for base case. When the relative throughput is > 1 then my results are better than the base case. When it is 1.10 then my results are ~10% better than the base case. The base case is InnoDB from upstream MySQL.
For point queries:


For range queries:


For writes:


Results: 20 threads
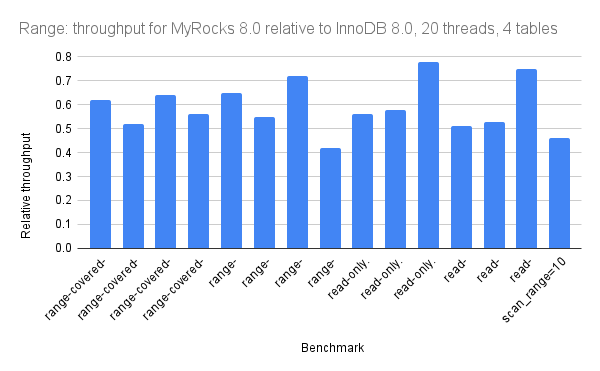
This section has results from the c2-standard-60 (large server) with 20 clients.
The graphs use relative throughput which is throughput for me / throughput for base case. When the relative throughput is > 1 then my results are better than the base case. When it is 1.10 then my results are ~10% better than the base case. The base case is InnoDB from upstream MySQL.
For point queries:


For range queries:

For writes:


No comments:
Post a Comment