My last post has results for MySQL/InnoDB on a big server and the database fit in the InnoDB buffer pool. Here I have results where the database fits in the OS page cache but not the InnoDB buffer pool.
The context for the results is short-running queries, in-memory (cached by the OS) with high-concurrency (20 clients) on a big server (30-cores). The goals are:
- Understand the impact of compiler optimizations
- Document how performance has changed from MySQL 5.6 to 5.7 to 8.0
- Document performance with fast storage (reading from the OS page cache is fast)
tl;dr
- The rel_lto build improves QPS by up to 3%
- 8.0 releases look much better here with a big server & high-concurrency than on the small server with low-concurrency.
- For changes from 5.6 to 8.0
- Point queries - version 8.0.32 gets about 3X more QPS than 5.6.51 on most of the microbenchmarks. This is much better than the previous result where the database fits in the buffer pool.
- Range queries - version 8.0.32 gets about 14% more QPS than 5.6.51. This is much better than the previous result where the database fits in the buffer pool.
- Writes - version 8.0.32 gets the same QPS as version 5.6.51. This is much worse than the previous result where the database fits in the buffer pool.
Benchmark
A description of how I run sysbench is here. Tests use the a c2-standard-60 server on GCP with 30-cores, hyperthreading disabled, 240G RAM and 3TB of local attached NVMe. The sysbench tests were run for 20 clients, 600 seconds per microbenchmark using 4 tables with 50M rows per table. All tests use the InnoDB storage engine. The test database fits in the InnoDB buffer pool.
Builds
I tested MySQL versions 5.6.51, 5.7.40, 8.0.22, 8.0.28, 8.0.31 and 8.0.32 using multiple builds for each version. For each build+version the full set of sysbench microbenchmarks was repeated. More details on the builds are in the previous post. To save time I only tested all builds for 8.0.31 and for other versions used the rel_lto build.
Results: all versions
The spreadsheet is here. See the 56_to_80.redo.4g tab.
The graphs use relative throughput which is throughput for me / throughput for base case. When the relative throughput is > 1 then my results are better than the base case. When it is 1.10 then my results are ~10% better than the base case. The base case here is MySQL 5.6.51 using the rel_lto build.
There are three graphs per version which group the microbenchmarks by the dominant operation: one for point queries, one for range queries, one for writes. There is much variance within each of the microbenchmark groups:
- Point queries - most of the microbenchmarks get about 3X more QPS in 8.0 than 5.6. The exceptions are hot-points_range=100, point-query.pre_range=100 and point-query.range=100. Two of the exceptions select one row per query while the microbenchmarks that are 3X faster tend to have a large in-list.
- Range queries - most of the microbenchmarks have a relative throughput between 0.8 and 1.2 with 8.0 compared to 5.6.51. There are two outliers that are more than 3X faster in 8.0 -- range-notcovered-si.pre_range=1000 and range-notcovered-si_range=1000 which use oltp_points_covered.lua. The two exceptions do a range scan on a non-covering secondary index so there will be more reads from the OS page cache for these.
- Writes - there is not much variance in the microbenchmarks except for read-write* which use the classic sysbench transaction that includes range queries. Perhaps their improvement in 8.0 vs 5.6 is mostly do to the improvements in range queries, but their cousin (read-only*) which uses the same SQL excluding the writes doesn't show such an improvement. This is a mystery.
Summary statistics:
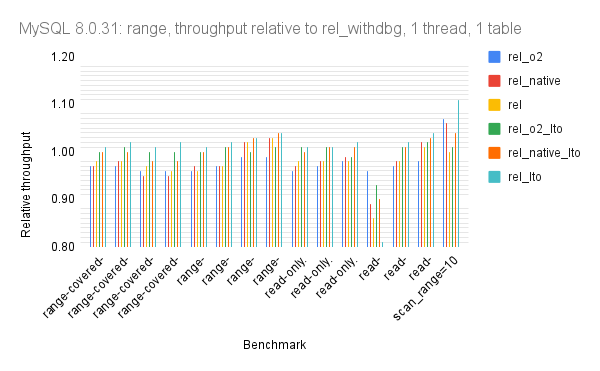
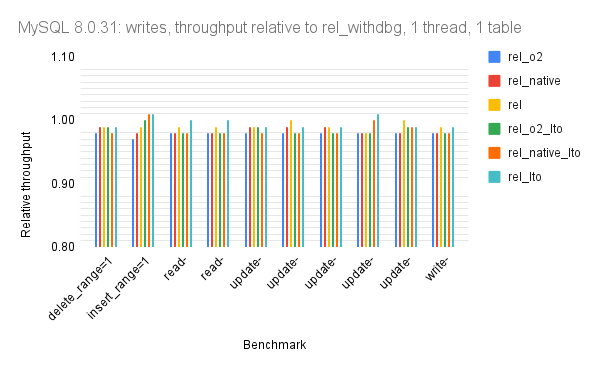
Results: MySQL 8.0.31
The spreadsheet is here. See the my8031.redo.4g tab.
The graphs use relative throughput which is throughput for me / throughput for base case. When the relative throughput is > 1 then my results are better than the base case. When it is 1.10 then my results are ~10% better than the base case. The base case here is MySQL 8.0.31 using the rel_withdbg build.
There are three graphs per version which group the microbenchmarks by the dominant operation: one for point queries, one for range queries, one for writes. For each group of microbenchmarks:
- Point queries - there is little variance across the microbenchmarks
- Range queries - the full table scan test (scan_range=10) shows the best improvement from the rel_lto build. I don't understand the noisy result for the read-only_range=10000 microbenchmark. Perhaps buffer pool writeback was still in progress as that microbenchmark is run shortly after the write-heavy microbenchmarks.
- Writes - there is little variance across the microbenchmarks


No comments:
Post a Comment