This is a follow to the results I published for the impact of max_background_jobs on RocksDB performance. The previous post used an IO-bound workload. This post uses a cached workload. The purpose for this work is to evaluate my rule of thumb that the number of busy threads should be <= the number of CPU cores. This is explained in detail in the previous post.
tl;dr
- Similar to the results for IO-bound, while throughput increases with concurrency, so does variance so my rule of thumb still holds (keep the number of busy threads <= the number of cores).
Details
In this post I use jobs=X to indicate the value for max_background_jobs. Tests were run for jobs=8 and jobs=16. Command lines are here for a run that uses max_background_jobs=8 and 8 client threads. The IO-bound test used a database with 4B key-value pairs. This test uses 40M key-value pairs so the database fits in the RocksDB block cache. See the previous post for more details.
Results: throughput
The benchmark summaries are here for 1, 8, 16, 24, 32, 40, 48, 56, 64, 72 and 80 client threads.
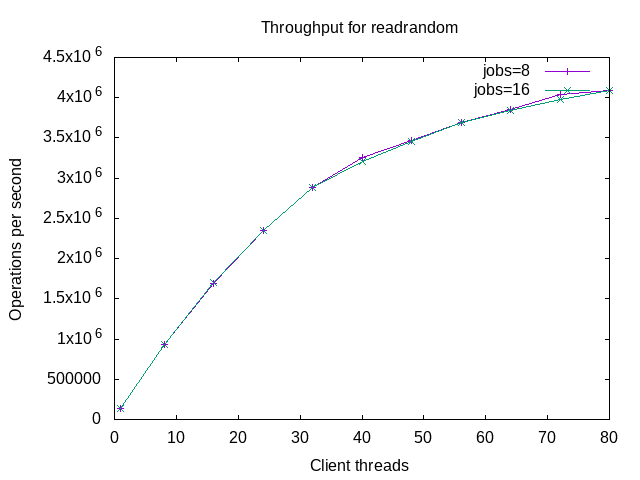
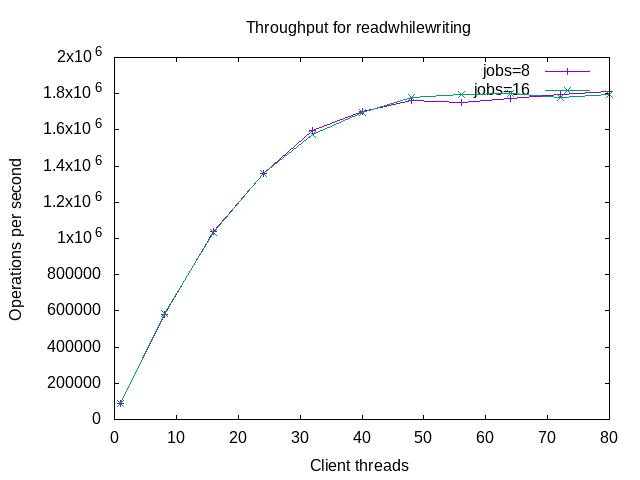
For all of the throughput graphs below except overwrite, the improvement with concurrency after 32 client threads isn't as good compared to the IO-bound results in the previous post. This is expected because the results here are for a CPU-bound workload, the server has 40 CPUs with 80 HW threads, and hyperthreading doesn't double compute capacity. The overwrite case is special because 1 client thread is sufficient to saturate throughput and beyond that the extra client threads just interfere with compaction threads.
Graphs for throughput are next. The first graph is for readrandom. I don't share the graph for fillseq because the benchmark step finishes in less than 1 minute. Throughput improves with concurrency but the improvement degrades with more concurrency.
The graph for fwdrangewhilewriting is similar to readrandom.
The next graph is for read while writing. The curve here is straighter than the curve above for fwdrangewhilewriting. I have yet to explain that.
And the final graph is for overwrite. There is an interesting artifact between 64 and 80 client threads. I have yet to explain that.
Results: throughput vs time
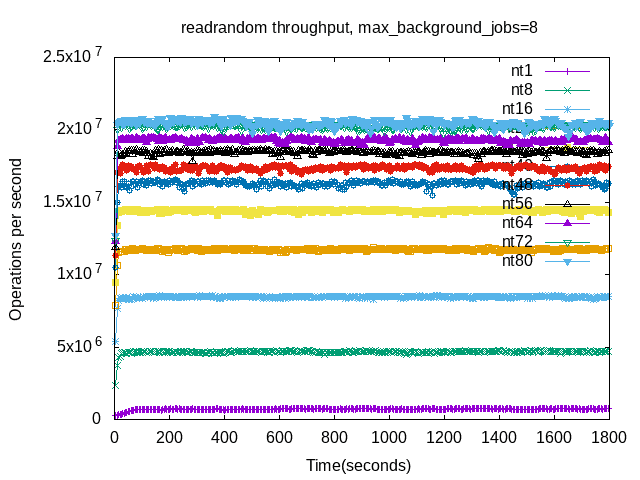
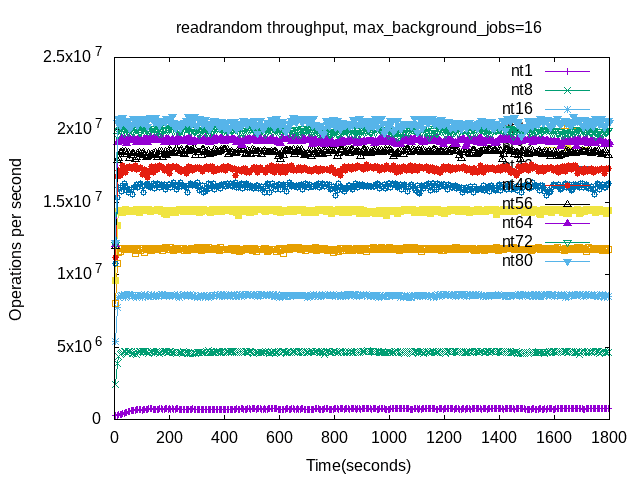
The next graphs display throughput per 5-second interval. There are two graphs per benchmark step -- one for jobs=8 and another for jobs=16.
The graphs for fwdrangewhilewriting have more variance with increase concurrency compared to readrandom. This is expected for two reasons. First, there is less CPU because client threads compete with compaction threads for CPU. Second, there is more mutex contention and can be more write stalls. In this case there weren't any write stalls but mutex contention is harder to measure. Also note that throughput doesn't improve much beyond 32 client threads. This is also OK.
The overwrite graphs show the most variance to the point that they are hard to read. Keep on reading and there will be other graphs. Note that 1 client thread is sufficient to saturate throughput for overwrite and extra threads just compete for the CPU with compaction threads and increase variance.
The results for overwrite have much variance even at 1 client thread. The results for jobs=8 and jobs=16 are similar. The worst-case write stalls are less than 0.5 seconds.
The results for overwrite with 8 client threads have a different pattern than 1 client thread, but still much variance.
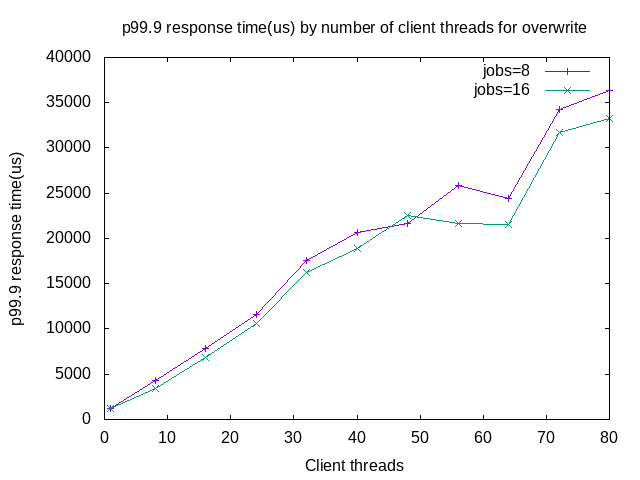
The p50 response times are similar for jobs=8 and jobs=16.
The p99.99 response times are similar for jobs=8 and jobs=16.
The max response times are similar for jobs=8 and jobs=16, but less so than the graphs above.
The graphs for write stall% are similar for jobs=8 vs jobs=16 but not similar to the graphs above. The best (lowest) case occurs for 1 client thread. The worst is for ~32 client threads. I don't know why it drops from there.







No comments:
Post a Comment