Thursday, June 27, 2024

The impact of link time optimization for MySQL with sysbench

This post has results to show the benefit from using link time optimization for MySQL. That is enabled via the CMake option -DWITH_LTO=ON.

tl;dr

  • A typical improvement is ~5% more QPS from link time optimization
  • On the small servers (PN53, SER4) the benefit from link-time optimization was larger for InnoDB than for MyRocks. On the medium server (C2D) the benefit was similar for MyRocks and InnoDB.
Builds

I used InnoDB from MySQL 8.0.37 and MyRocks from FB MySQL compiled on git sha 65644b82c which uses RocksDB 9.3.1 and was latest as of June 12, 2024. The compiler was gcc 11.4.0.

Hardware

I tested on three servers:
  • SER4 - Beelink SER 4700u (see here) with 8 cores and a Ryzen 7 4700u CPU 
  • PN53 - ASUS ExpertCenter PN53 (see here) with 8 cores and an AMD Ryzen 7 7735HS CPU
  • C2D - a c2d-highcpu-32 instance type on GCP (c2d high-CPU) with 32 vCPU and SMT disabled so there are 16 cores
All servers use Ubuntu 22.04 with ext4. 

Benchmark

I used sysbench and my usage is explained here. There are 42 microbenchmarks and most test only 1 type of SQL statement. The database is cached by MyRocks and InnoDB.

The benchmark is run with:
  • SER4, PN53 - 1 thread, 1 table and 30M rows
  • C2D - 12 threads, 8 tables and 10M rows per table
  • each microbenchmark runs for 300 seconds if read-only and 600 seconds otherwise
  • prepared statements were enabled
The command lines for my helper scripts were:
# PN53, SER4
bash r.sh 1 30000000 300 600 nvme0n1 1 1 1
# C2D
bash r.sh 8 10000000 300 600 md0 1 1 12

Results

For the results below I split the 42 microbenchmarks into 5 groups -- 2 for point queries, 2 for range queries, 1 for writes. For the range query microbenchmarks, part 1 has queries that don't do aggregation while part 2 has queries that do aggregation. The spreadsheet with all data and charts is here. For each group I present a chart and a table with summary statistics.

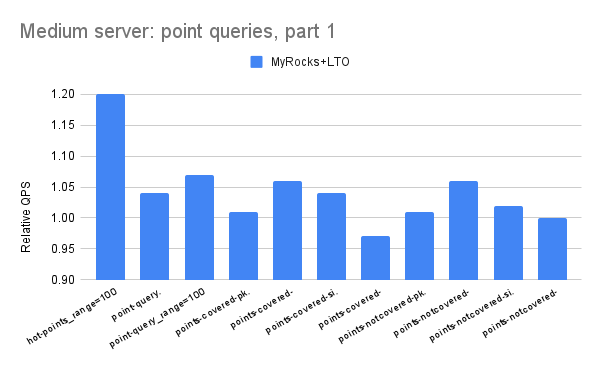
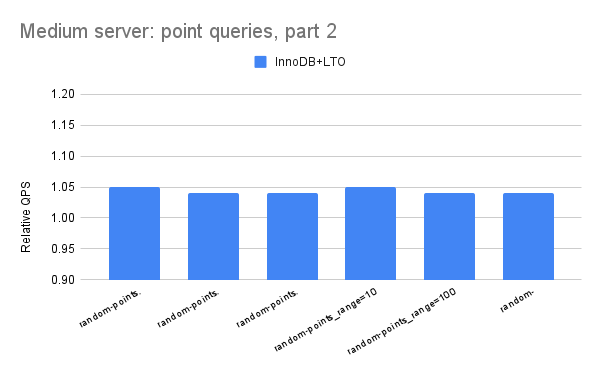
All of the charts have relative throughput on the y-axis where that is (QPS with LTO) / (QPS without LTO) and with LTO means link-time optimization was enabled. The y-axis doesn't start at 0 to improve readability. When the relative throughput is > 1 then that version of MySQL with link-time optimization is faster.

The legend under the x-axis truncates the names I use for the microbenchmarks and I don't know how to fix that other than sharing links (see above) to the Google Sheets I used.

Results: SER4

Summary statistics for MyRocks

minmaxavgmedian
point-10.981.081.031.03
point-21.031.051.031.03
range-10.901.051.001.02
range-20.981.051.021.02
writes1.031.101.061.07

Summary statistics for InnoDB

minmaxavgmedian
point-11.051.121.071.06
point-21.051.061.061.06
range-11.051.141.091.09
range-21.061.081.071.07
writes1.031.091.081.08

There are two charts per section -- the first for MyRocks, the second for InnoDB.

Point queries, part 1
Point queries, part 2
Range queries, part 1
Range queries, part 2
Writes

Results: PN53

Summary statistics for MyRocks

minmaxavgmedian
point-11.031.151.071.05
point-21.031.081.051.05
range-10.951.061.041.04
range-21.021.081.051.05
writes1.051.071.061.06

Summary statistics for InnoDB

minmaxavgmedian
point-11.061.201.101.08
point-21.061.091.071.07
range-11.061.071.061.06
range-21.021.051.041.04
writes1.011.081.051.06

There are two charts per section -- the first for MyRocks, the second for InnoDB. 

Point queries, part 1
Point queries, part 2
Range queries, part 1
Range queries, part 2
Writes

Results: C2D

Summary statistics for MyRocks

minmaxavgmedian
point-10.971.201.041.04
point-21.011.061.041.05
range-11.011.071.041.05
range-21.031.071.041.03
writes1.011.071.031.03

Summary statistics for InnoDB

minmaxavgmedian
point-11.041.061.051.05
point-21.041.051.041.04
range-11.041.061.051.04
range-21.011.051.031.04
writes1.011.041.031.03

There are two charts per section -- the first for MyRocks, the second for InnoDB. The charts use the name Medium server instead of C2D.

Point queries, part 1
Point queries, part 2
Range queries, part 1
Range queries, part 2
Writes


Wednesday, June 26, 2024

A simple test to measure CPU per IO

What should I expect with respect to CPU overhead and latency when using the public cloud. I won't name the vendor here because they might have a DeWitt Clause.

Hardware

My server has 16 real cores, HT or SMT disabled, Ubuntu 22.04 and ext4 is used in all cases. The two IO setups tested are:

  • local - 2 NVMe devices with SW RAID 0
  • network - 1TB of fast cloud block storage that is backed by SSD and advertised as being targeted for database workloads.
Updates:
  • Fixed a silly mistake in the math for CPU usecs per block read
Benchmark

This uses fio with O_DIRECT to do 4kb block reads. My benchmark script is here it is run by the following command lines and I ignore the result of the first run:
for d in 8 16 32 ; do bash run.sh local2_iod${d} /data/m/t.fio io_uring $d 300 512G ; done
for d in 4 8 16 32 ; do bash run.sh network_iod${d} /data2/t.fio io_uring $d 300 900G ; done

Results

I compute CPU usecs as: (((vmstat.us + vmstat.sy)/100) * 16 * 1M) / IOPs where
  • vmstat.us, vmstat.sy - the average value for the us (user) and sy (system) columns in vmstat
  • 16 - the number of CPU cores
  • 1M - scale from CPU seconds to CPU microseconds
  • IOPs - average number of r/s per fio
With a queue depth of 8
  • local: ~54k reads/s at ~150 usecs latency and ~10.16 CPU usecs/read
  • network: ~15k reads/s at ~510 usecs latency and ~12.61 CPU usecs/read
At queue depth =16 I still get ~15k reads/s from network so the setup is already saturated at queue depth =8 and ignore the results for =16.

From these results and others that I have not shared the CPU overhead per read from using cloud block storage is ~2.5 CPU usecs in absolute terms and ~24% in relative terms. I don't think that is bad.

Monday, June 24, 2024

The Insert Benchmark: Postgres 17beta1, large server, IO-bound

This post has results for the Insert Benchmark on a large server with an IO-bound workload. The goal is to compare new Postgres releases with older ones to determine whether get better or worse over time. The results here are from a large server (32 cores, 128G RAM). Results from the same setup with a cached workload are here.

This work was done by Small Datum LLC.

tl;dr

  • There are no regressions from Postgres 16.3 to 17beta1 for this benchmark
  • The patch to enforce VISITED_PAGES_LIMIT during get_actual_variable_range fixes the problem with variance from optimizer CPU overhead during DELETE statements, just as it did on a small server and also on a large server with a cached workload. And 17beta1 with the patch gets ~12X more writes/s than without the patch.
  • This is my first result with ext4. I had to switch because XFS with the 6.5 kernel (HWE enabled, Ubuntu 22.04) don't play great together for me
Build + Configuration

This post has results from Postgres versions 10.23, 11.22, 12.19, 13.15, 14.12, 15.7, 16.3 and 17beta1. All were compiled from source. I used configurations that are as similar as possible but I won't have access to the test machines for a few days. The config files are here and I used the file named conf.diff.cx9a2a_c32r128.

For 17beta1 I also tried a build with a patch to enforce VISITED_PAGES_LIMIT during get_actual_variable_range and the results are great (as they were previously great in the results explained here).

The Benchmark

The benchmark is run with 12 client, a cached workload and 12 tables with a table per client. It is explained here.

The test server was named v7 here and is an a Dell Precision 7865 with 32 AMD cores (SMT disabled), 128G RAM, ext4 (data=writeback, 2 m.2 devices, SW RAID 0) and Ubuntu 22.04 with an HWE kernel.

The benchmark steps are:

  • l.i0
    • insert 300 million rows per table in PK order. The table has a PK index but no secondary indexes. There is one connection per client.
  • l.x
    • create 3 secondary indexes per table. There is one connection per client.
  • l.i1
    • use 2 connections/client. One inserts 4M rows per table and the other does deletes at the same rate as the inserts. Each transaction modifies 50 rows (big transactions). This step is run for a fixed number of inserts, so the run time varies depending on the insert rate.
  • l.i2
    • like l.i1 but each transaction modifies 5 rows (small transactions) and 1M rows are inserted and deleted per table.
    • Wait for X seconds after the step finishes to reduce variance during the read-write benchmark steps that follow. The value of X is a function of the table size.
  • qr100
    • use 3 connections/client. One does range queries and performance is reported for this. The second does does 100 inserts/s and the third does 100 deletes/s. The second and third are less busy than the first. The range queries use covering secondary indexes. This step is run for 1800 seconds. If the target insert rate is not sustained then that is considered to be an SLA failure. If the target insert rate is sustained then the step does the same number of inserts for all systems tested.
  • qp100
    • like qr100 except uses point queries on the PK index
  • qr500
    • like qr100 but the insert and delete rates are increased from 100/s to 500/s
  • qp500
    • like qp100 but the insert and delete rates are increased from 100/s to 500/s
  • qr1000
    • like qr100 but the insert and delete rates are increased from 100/s to 1000/s
  • qp1000
    • like qp100 but the insert and delete rates are increased from 100/s to 1000/s
Results: overview

The performance report is here.
    The summary in each performance report has 3 tables. The first shows absolute throughput by DBMS tested X benchmark step. The second has throughput relative to the version from the first row of the table. The third shows the background insert rate for benchmark steps with background inserts and all systems sustained the target rates. The second table makes it easy to see how performance changes over time. The third table makes it easy to see which DBMS+configs failed to meet the SLA.

    Below I use relative QPS to explain how performance changes. It is: (QPS for $me / QPS for $base) where $me is my version and $base is the version of the base case. The base case here is Postgres 10.23. When relative QPS is > 1.0 then performance improved over time. When it is < 1.0 then there are regressions. The Q in relative QPS measures: 
    • insert/s for l.i0, l.i1, l.i2
    • indexed rows/s for l.x
    • range queries/s for qr100, qr500, qr1000
    • point queries/s for qp100, qp500, qp1000
    Below I use colors to highlight the relative QPS values with red for <= 0.95, green for >= 1.05 and grey for values between 0.95 and 1.05.

    Results: details

    The base case is Postgres 10.23 with the cx9a2a_c32r3128 config (pg1023_def.cx9a2a_c32r128). It is compared with:
    • Postgres 16.3 (pg163_def.cx9a2a_c32r128)
    • Postgres 17beta1 unchanged (pg17beta1_def.cx9a2a_c32r128)
    • Postgres 17beta1 with the patch to enforce VISITED_PAGES_LIMIT (pg17beta1_def_hack100.cx9a2a_c32r128)
    tl;dr
    • Postgres 16.3 and 17beta1 have similar performance
    • The patch to enforce VISITED_PAGES_LIMIT is great (see impact for l.i1, l.i2)
    Results with the VISITED_PAGES_LIMIT patch applied to 17beta1 are great
    • From the summary the write rate is ~1.1X larger in l.i1 and ~12X larger in l.i2 for 17beta1 with the patch vs without.
    • From the vmstat metrics for l.i1 and l.i2 the CPU overhead with the patch is ~1/3 of what it is without the patch. See the cpupq (CPU/operation) and cpups (CPU utilization) columns.
    • From the per-second charts for l.i2 there is more variance in the results for 17beta1 with the patch because it is doing ~12X more write/s (see 17beta1 without and with the patch)
    From the summary the relative throughput per benchmark step is:
    • l.i0
      • relative QPS is 1.19 in PG 16.3
      • relative QPS is 1.24 in PG 17beta1 unchanged
      • relative QPS is 1.27 in PG 17beta1 with VISITED_PAGES_LIMIT patch
    • l.x - I ignore this for now
    • l.i1, l.i2
      • relative QPS is 1.44, 1.68 in PG 16.3
      • relative QPS is 1.41, 1.56 in PG 17beta1 unchanged
      • relative QPS is 1.5519.25 in PG 17beta1 with VISITED_PAGES_LIMIT patch
    • qr100, qr500, qr1000
      • relative QPS is 1.041.081.17 in PG 16.3
      • relative QPS is 1.041.071.14 in PG 17beta1 unchanged
      • relative QPS is 1.031.091.27 in PG 17beta1 with VISITED_PAGES_LIMIT patch
    • qp100, qp500, qp1000
      • relative QPS is 1.00, 1.021.09 in PG 16.3
      • relative QPS is 1.001.02, 1.11 in PG 17beta1 unchanged
      • relative QPS is 1.00, 1.03, 1.14 in PG 17beta1 with VISITED_PAGES_LIMIT patch

    Evaluating vector indexes in MariaDB and pgvector: part 2

    This post has results from the ann-benchmarks with the   fashion-mnist-784-euclidean  dataset for MariaDB and Postgres (pgvector) with conc...