Monday, October 5, 2015

MyRocks versus allocators: glibc, tcmalloc, jemalloc

I used a host with Fedora 19 and Linkbench to determine the ability of memory allocators to avoid fragmentation with MyRocks (MySQL+RocksDB). RocksDB can create pressure on an allocator because allocations for the block cache can have a short lifetime. Memory is allocated on page read and released when a page is evicted from the cache. The allocation is the size of the decompressed page and sometimes the size of the compressed page. RocksDB puts more pressure on the allocator than InnoDB because with InnoDB the buffer pool allocation is done once at process start. After the Linkbench load finished I ran the query test for 24 hours and report the values of VSZ and RSS from ps at the end. From the results below jemalloc & tcmalloc do much better at avoiding fragmentation (value of RSS) compared to glibc 2.1.7. I am still adjusting to larger values of VSZ with jemalloc. It isn't a problem, but it takes time to accept.

VSZ       RSS       allocator
22246784  10062100  jemalloc
13600032  10545284  tcmalloc
26136152  20313268  glibc

Test details:
  • Linkbench with maxid=100M, loaders=10, requesters=20
  • MyRocks with 8G block cache for RocksDB
  • libc is glibc 2.17, tcmalloc from gperftools 2.1, jemalloc 3.6.0

Friday, October 2, 2015

Wanted: a file system on which InnoDB transparent page compression works

I work on MyRocks, which is a MySQL storage engine with RocksDB. This is an alternative to InnoDB. It might be good news for MyRocks if transparent page compression is the future of InnoDB compression. I got more feedback from the MySQL team that despite the problems I have reported, transparent page compression works. I was just testing the wrong systems.

So I asked core developers from Btrfs whether it was OK to do punch hole per write and they politely told me to go away. Bcachefs might be a great way to add online compression to a b-tree without doing punch hole per write but it is not ready for production. Someone from MySQL suggested I try ext4 so I setup two servers with Ubuntu 14.04 which is on the list of supported systems. I used XFS on one and ext4 on the other.

XFS was still a problem and ext4 was just as bad. The problem is that the unlink() system call takes a ridiculous amount of time after a multi-GB file has been subject to many punch hole writes. By ridiculous I mean 50X or 100X longer. Maybe I am the only one using InnoDB file-per-table and measuring time to drop a table or database. Bad things happen when DROP takes 10+ minutes --InnoDB is unusable by other connections and an InnoDB background thread might kill mysqld because it thinks there is an internal deadlock.

Did I mention this was good news for MyRocks? If you want compression then we get 2X better compression compared to compressed InnoDB. We also made sure that DROP TABLE and DROP INDEX are fast.

I updated bug 78277 for this problem. I am the only person updating that bug. I also found a corruption bug with transparent page compression, bug 78672. Past experience with transparent page compression is described here, here and here.

The end to my testing day was perfect. I rebooted the host to get back memory from XFS metadata allocations and the filesystem came back corrupt. Being a pessimist I was using a scratch filesystem for this, so I didn't lose my Ubuntu install.

Tuesday, September 8, 2015

Third day with InnoDB transparent page compression

My first two days with InnoDB transparent page compression didn't turn out well. Transparent page compression can make InnoDB source code simpler and InnoDB more performant on insert heavy workloads. Unfortunately the versions of XFS that I use are not happy after doing a hole-punch on write. The performance summary is that with transparent compression:

  • Database load is slightly faster
  • Transaction processing is slightly slower
  • DROP TABLE is 43X slower

MySQL 5.6 vs 5.7

I used a host with 24 HW threads, 144G of RAM and a 400G Intel s3700 SSD. The server uses Fedora 19, XFS and Linux kernel 3.14.27-100.fc19. The benchmark application is linkbench and was run with maxid1=100M, loaders=10 and requesters=20 (10 clients for the load, 20 for queries). I compared the Facebook patch for MySQL 5.6 with upstream MySQL 5.7. For 5.6 I used old-style compression for linktable and counttable. For 5.7 I used transparent compression for all tables. I also used 32 partitions for 5.6 and no partitions for 5.7. After the database was loaded I ran the query test for 140 loops with 1 hour per loop.

The table below has data for the Facebook patch for MySQL 5.6 (fb56) and upstream 5.7.8 (orig578). The results are the row insert rate during the load (ips) and the average QPS of the Nth hourly run (qps@N). The QPS is better for MySQL 5.6 and the load rate is better for 5.7 but I don't know how much of that is due to the use of partitions for 5.6. I ran DROP TABLE after the test and that took ~8 minutes for MySQL 5.7.8. More details are in a previous post.


          fb56      orig578
ips       55199     81970
qps@20    13731     10581
qps@40    12172      9874
qps@60    11353      8875
qps@80    10977      8234
qps@100   10793      8021
qps@120   10691      7946
qps@140   10636      7949

Transparent vs old-style compression

I then ran a test for 24 hours to compare MySQL 5.7.8 in two setups and both used partitions for all tables. They differed in that one used old-style compression and the other used transparent compression. The results were similar to the comparison with MySQL 5.6 as the load was faster with transparent compression. transaction processing was faster with old-style compression and DROP TABLE was ~30X slower with transparent compression.

After the linkbench load I ran the query test for 24 1-hour loops. At test end the database with old-style compression was 4% larger than transparent compression, but it also had more data as it sustained a higher QPS rate. I didn't count the number of rows to determine whether it had 4% more data.

The table below displays the row insert rate during the load (ips) and the average QPS from 1-hour runs at the 2nd, 12th and 24th hours (qps@N). The load rate is better with transparent compression and the QPS is better with old-style compression.


           578, old-style    578, transparent
ips        72566             79518
qps@2      16542             15504
qps@12     16079             15136
qps@24     15506             14383

Transparent compression doesn't have to provide better compression or performance to be a win, but it needs to be stable. I ran DROP DATABASE at test end and that took 5 seconds for old-style compression vs 216 seconds for transparent. The database was ~100G when dropped.

This paste has the output from the 24th 1-hour run of the linkbench query test. There are two sections, the first is from old-style compression and the second from transparent compression. For most of the linkbench operations old-style is slightly faster. But the max times for operations is much worse (~2X) with transparent.

Friday, September 4, 2015

Linkbench for MySQL 5.7.8 with an IO-bound database

I wanted to try InnoDB transparent page compression that is new in the MySQL 5.7.8 RC. That didn't work out, so I limited my tests to old-style compression. I compared MyRocks with InnoDB from the Facebook patch for 5.6, upstream 5.6.26 and upstream 5.7.8. My performance summary is:

  • MyRocks loads data faster than InnoDB. This isn't a new result. Non-unique secondary index maintenance doesn't require a read before the write (unlike a B-Tree). This is also helped by less random IO on writes and better compression.
  • MyRocks compression is much better than compressed InnoDB. After 24 hours it used between 56% and 64% of the space compared to the compressed InnoDB configurations.
  • MyRocks QPS degrades over time. This will be fixed real soon.
  • Partitioning improves InnoDB load performance in MySQL 5.6 for compressed and non-compressed tables. This reduces stalls from the per-index mutex used by InnoDB when inserts cause or might cause a page split (pessimistic code path) because there is one mutex per partition. With MySQL 5.7 partitioning doesn't help in the non-compressed table case. There has been work in 5.7 to reduce contention on the per-index mutex and I think it helped. I suspect it is still needed with old-style compression because compressed page splits are more expensive as they include recompression.
  • The Facebook patch for MySQL 5.6 is faster than upstream 5.6 and competitive with upstream 5.7.8. Too bad that patches might not reach upstream.

Configuration

My test server has 144G of RAM, 40 HW threads with HT enabled and fast PCIe flash storage. I configured linkbench with loaders=10, requesters=20 and maxid1=1B. This uses 10 clients for the load, 20 clients for the query runs and about 1B rows in the node table after the load. The linkbench clients share the server with mysqld. The my.cnf settings are explained in a previous post.  The load was done with the binlog disabled. After the load there were 12 1-hour runs of the query test and I report results for hours 2 and 12. Then mysqld was restarted with the binlog enabled and 12 more 1-hour runs of the query test were done and I report results for hours 14 and 24. Fsync for the binlog was disabled. Fsync for the InnoDB redo log was done by a background thread (innodb_flush_log_at_trx_commit=2). Note that the InnoDB page size was 8kb so I used 2X compression for the link and count tables. The node table is not compressed for InnoDB because it is unlikely to compression by 50%.

I tested the following binaries:
  • myrocks - RocksDB storage engine for MySQL using the Facebook patch for MySQL 5.6
  • fb56 - InnoDB using the Facebook patch for MySQL 5.6
  • orig56 - upstream MySQL 5.6.26
  • orig57 - upstream MySQL 5.7.8
The partitioning and compression options are described by the following.  For partitioning I use 32 partitions and transactions/queries don't span partitions. All of the DDL is here.
  • p0 - no partitioning for RocksDB
  • p1 - partitioning for RocksDB
  • p0.c0 - no partitioning, no compression for InnoDB
  • p0.c1 - no partitioning, old-style compression for InnoDB
  • p1.c0 - partitioning, no compression for InnoDB
  • p1.c1 - partitioning, old-style compression for InnoDB

Results

This lists the database size in GB after the load and query tests at the 2nd, 12th, 14th and 24th hours. I don't have sufficient granularity in my measurement script for databases larger than 1T. I am not sure why compression with upstream 5.6 and 5.7 uses more space than with the Facebook patch.

Update - I removed the results for myrocks, p1 because my measurements were wrong.

load    2h      12h     14h     24h
gb      gb      gb      gb      gb      config
 487     493     512     514     523    myrocks, p0
.
11XX    11XX    12XX    12XX    13XX    fb56, p0.c0
 666     697     779     787     814    fb56, p0.c1
11XX    12XX    12XX    13XX    13XX    fb56, p1.c0
 707     745     803     808     826    fb56, p1.c1
.
12XX    12XX    13XX    14XX    14XX    orig56, p0.c0
 756     790     879     889     920    orig56, p0.c1
13XX    13XX    14XX    14XX    14XX    orig56, p1.c0
 803     838     901     907     930    orig56, p1.c1
.
12XX    13XX    14XX    14XX    15XX    orig57, p0.c0
 756     796     892     902     931    orig57, p0.c1
13XX    13XX    14XX    14XX    15XX    orig57, p1.c0
 803     844     844     916     940    orig57, p1.c1


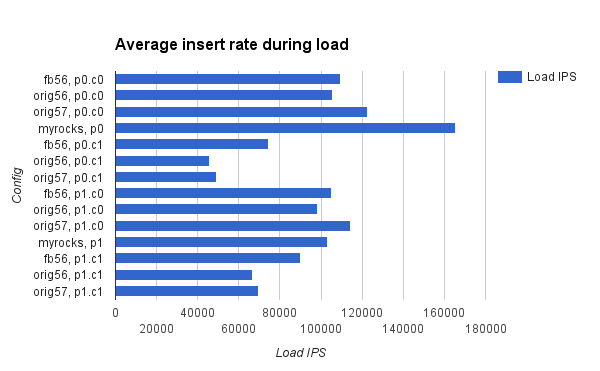
This lists the insert rate during the load (load ips) and the average query rates for the 2nd, 12th, 14th and 24th hours. Note that the query rate is lousy for p0.c1 immediately after the load. The problem is that the b-tree pages are almost full after the load and then over time many of them get split. There are stalls from page splits with compression and over time the page split rate drops.


load    2h      12h     14h     24h
ips     qps     qps     qps     qps     config
165210  31826   22347   21293   17888   myrocks, p0
103145  30045   22376   21325   18387   myrocks, p1
.
109355  21151   23733   23478   24865   fb56, p0.c0
 74210   8261   13928   14706   18656   fb56, p0.c1
104900  26953   26029   25161   25479   fb56, p1.c0
 90162  19888   24431   22596   22811   fb56, p1.c1
.
105356  16472   16873   16575   17073   orig56, p0.c0
 45966   7638   12492   13178   16516   orig56, p0.c1
 98104  18797   18273   17625   17702   orig56, p1.c0
 66738  17731   19854   19159   19418   orig56, p1.c1
.
122454  31009   30260   29905   29751   orig57, p0.c0
 49101   9217   17552   18448   22092   orig57, p0.c1
114400  28191   26797   25820   25832   orig57, p1.c0
 69746  22028   25204   23882   23983   orig57, p1.c1

This is the same data as above, but grouped by configuration.

load    2h      12h     14h     24h
ips     qps     qps     qps     qps     config
109355  21151   23733   23478   24865   fb56, p0.c0
105356  16472   16873   16575   17073   orig56, p0.c0
122454  31009   30260   29905   29751   orig57, p0.c0
.
165210  31826   22347   21293   17888   myrocks, p0
 74210   8261   13928   14706   18656   fb56, p0.c1
 45966   7638   12492   13178   16516   orig56, p0.c1
 49101   9217   17552   18448   22092   orig57, p0.c1
.
104900  26953   26029   25161   25479   fb56, p1.c0
 98104  18797   18273   17625   17702   orig56, p1.c0
114400  28191   26797   25820   25832   orig57, p1.c0
.
103145  30045   22376   21325   18387   myrocks, p1
 90162  19888   24431   22596   22811   fb56, p1.c1
 66738  17731   19854   19159   19418   orig56, p1.c1
 69746  22028   25204   23882   23983   orig57, p1.c1

Graphs

For people who prefer graphs I include one for the load rates and another for the QPS from the configurations that use partitioning.

Thursday, September 3, 2015

Second day with InnoDB transparent page compression

My first day with InnoDB transparent page compression didn't turn out OK, but I am an optimist so onto day 2. I gave up trying to use it on a host with CentOS 6.6, XFS and a 3.10.53 kernel. I had a bit more luck with a Fedora 19 host using XFS and a 3.14.27 kernel and I ran linkbench.

You can follow along here or at bug 78277.

I configured linkbench with maxid1=100M and the database was about 100GB after the load. I used MySQL 5.7.8 with transparent page compression. I won't share the performance results just yet, but at the and of 7 days of the query test I shutdown mysqld and my storage device (400G Intel s3700) had 180G free space. I confirmed that I was able to use at least 176 of the 180 GB, which was a good sign. However, the device was only able to write at ~60 MB/second while making copies of a 2G test file. File copies were writing at ~200 MB/second on a second host that has the same hardware, the same amount of free space, but didn't use hole-punch for compression. So this is one more cost of using hole-punch, it makes the filesystem much slower. But I don't blame XFS. I don't think that doing a hole-punch on every small write was the intended use for that feature.

Then I ran DROP DATABASE for the database used by linkbench. It contained 3 unpartitioned tables. Two were ~60G and one was ~10G. The DROP TABLE took 8 minutes. While that ran there were many warnings like this:
[Warning] InnoDB: Trying to close/delete/truncate tablespace 'linkdb/linktable' but there are 1 pending operations on it.
[Warning] InnoDB: Trying to close/delete/truncate tablespace 'linkdb/linktable' but there are 1 pending operations on it.

Then it got more exciting -- a long semaphore wait courtesy of a slow unlink. Alas the DROP TABLE finished before the background thread killed mysqld.
InnoDB: A long semaphore wait:--Thread 139616032126720 has waited at row0purge.cc line 830 for 241.00 seconds the semaphore:
S-lock on RW-latch at 0x327b74a8 created in file dict0dict.cc line 1153
a writer (thread id 139616238388992) has reserved it in mode  exclusive
number of readers 0, waiters flag 1, lock_word: 0
Last time read locked in file row0purge.cc line 830
Last time write locked in file /home/mdcallag/b/mysql-5.7.8-rc/storage/innobase/row/row0mysql.cc line 4202
InnoDB: ###### Starts InnoDB Monitor for 30 secs to print diagnostic info:


Monday, August 31, 2015

Cached linkbench performance for MySQL 5.7.8, 5.6, WebScale and MyRocks

This extends previous results for Linkbench to compare performance for a cached database with concurrent clients. My conclusions are:
  • InnoDB compression in the Facebook patch for MySQL 5.6 is much faster for insert-heavy workloads than the same feature in upstream 5.6 and 5.7. Too bad those changes might not reach upstream. 
  • InnoDB transparent page compression is faster than non-transparent for write-heavy workloads assuming that feature is OK to use on your servers.
  • QPS for MyRocks suffers over time. We have work-in-progress to fix this. Otherwise it is already competitive with InnoDB. Compression with MyRocks is much better than InnoDB for linkbench data. That has also been true for real workloads.
  • Load rates are higher for compressed InnoDB tables when partitioning is used for 5.6 but not for 5.7. I didn't debug the slowdown in 5.7. It has been a win in the past for IO-bound linkbench because it reduces contention on the per-index mutex in InnoDB. Work has been done in 5.7 to reduce the contention on the per-index mutex.

Setup

The database size was between 10G and 30G after the load. The test was run with maxid=20000001, loaders=10 & requesters=20. Otherwise the default settings for linkbench were used. The InnoDB buffer pool was large enough to cache the database. The server has 144G of RAM, fast PCIe flash storage and 40 HW threads with HT enabled. The binlog was enabled but fsync was not done for the binlog or InnoDB redo log on commit. I tested several configurations for compression and partitioning:
  • p0.c0 - no partitioning, no compression
  • p0.c1 - no partitioning, compression (transparent & non-transparent)
  • p1.c0 - partitioning, no compression
  • p1.c1 - partitioning, compression (transparent & non-transparent)
I tested several binaries:
  • myrocks - the Facebook patch for MySQL, 5.6.X and the RocksDB storage engine
  • fb56 - the Facebook patch for MySQL, 5.6.X and InnoDB
  • orig56.ps - upstream 5.6.26 with the performance schema (PS) enabled
  • orig57.ps - upstream 5.7.8 with non-transparent compression and PS enabled
  • orig57.tc - upstream 5.7.8 with transparent compression and PS enabled
The test was done in two parts. First I measure the load performance, then I run the query test for 12 1-hour intervals. The data below is the insert rate from the load (load ips), the size after load (load gb), the QPS rate during the second and twelfth 1-hour runs (2h qps, 12h qps) and the size after the second and twelfth 1-hour runs (2h gb, 12h gb).

p0.c0
load    load    2h      2h      12h     12h
ips     gb      qps     gb      qps     gb      config
136041  14      43784   18      24298   20      myrocks
109724  22      49881   31      48459   51      fb56
103030  24      39979   34      39582   54      orig56.ps
116343  24      48506   35      48112   58      orig57.ps

p0.c1
load    load    2h      2h      12h     12h
ips     gb      qps     gb      qps     gb      config
 73115  15      42508   20      35766   32      fb56
 45660  16      36474   22      33107   34      orig56.ps
 46737  16      40890   22      37305   36      orig57.ps
101966  17      33716   23      29695   37      orig57.tc

p1.c0
load    load    2h      2h      12h     12h
ips     gb      qps     gb      qps     gb      config
101783  26      34342   30      21883   36      myrocks
105099  24      48686   33      47369   52      fb56
 97931  27      39343   36      39000   55      orig56.ps
109230  27      46671   37      46155   59      orig57.ps

p1.c1
load    load    2h      2h      12h     12h
ips     gb      qps     gb      qps     gb      config
 91884  15      46852   21      45223   36      fb56
 74080  17      39379   23      38627   38      orig56.ps
 77037  17      45156   24      44070   40      orig57.ps
 87708  19      37062   25      32424   40      orig57.tc

Graphs!

And for people who want graphs this has the average insert rate from the load and the average query rate from the twelfth hour for the p0.c0 test (no partitioning, no compression).


Friday, August 28, 2015

First day with InnoDB transparent page compression

I ran linkbench overnight for a database that started at 100G using MySQL 5.7.8 and InnoDB transparent page compression. After ~24 hours I have 1 mysqld crash with nothing in the error log. I don't know if that is related to bug 77738. I will attach gdb and hope for another crash. For more about transparent page compression read here, here and here. For concerns about the feature see the post by Domas. I previously wrote about this feature.

On the bright side, this is a great opportunity for MyRocks, the RocksDB storage engine for RocksDB.

Then I ran 'dmesg -e' and get 81 complaints from XFS on the host that uses transparent compression. The warnings are from the time when the benchmark ran. My other test host isn't using hole-punch and doesn't get these warnings. I get the same error message below from a host with CentoOS 6.6 host using a 3.10.53 kernel.

[Aug27 05:53] XFS: possible memory allocation deadlock in kmem_alloc (mode:0x250)
[  +1.999375] XFS: possible memory allocation deadlock in kmem_alloc (mode:0x250)
[  +1.999387] XFS: possible memory allocation deadlock in kmem_alloc (mode:0x250)
[  +1.983386] XFS: possible memory allocation deadlock in kmem_alloc (mode:0x250)
[  +1.999379] XFS: possible memory allocation deadlock in kmem_alloc (mode:0x250)


The host has Fedora 19 and the kernel is 3.14.27-100.fc19.x86_64. I don't know if Fedora 19 is officially supported. I know that hole punch is available because this is in the error log:
    [Note] InnoDB: PUNCH HOLE support available

And this was used in a create table statement:
    ENGINE=InnoDB COMPRESSION="zlib" DEFAULT CHARSET=latin1;

From my host without hole-punch where the files for the table are ~44G.
    $ xfs_bmap /ssd1/scratch/data.mdcallag/data/linkdb/linktable*.ibd | wc -l
    11446


And the host with it  where the files for the table are ~104G according to ls but are much smaller because of the holes.
    $ xfs_bmap /ssd1/scratch/data.mdcallag/data/linkdb/linktable.ibd  | wc -l
    11865620


I don't like the vmstat output either. On the host that uses transparent page compression swap is being used and that started during the linkbench load. It is not being used on the other host. Doesn't look right.

 procs -----------memory---------- ---swap-- -----io---- -system-- ----cpu----
 r  b   swpd   free   buff  cache   si   so    bi    bo   in   cs us sy id wa
13  6 4095996 8410200   1164 6298324    0    0    65   534    0    0  8  1 89  2


But wait, there is more

This is from a host with CentOS 6.6 and the 3.10.53 kernel. After running for a few hours with transparent page compression mysqld got stuck. I looked in the database error log and there was the standard output from threads getting long waits on InnoDB synchronization objects. I attached gdb to look at thread stacks, and that took ~15 minutes just to attach. Fortunately I got stacks before needing to reboost this host. All threads appear to be blocked on calls into the kernel. This gist shows two of the threads -- one is stuck doing aio and another trying to do fallocate64 called from os_file_punch_hole.

Deadlocked mysqld + reboot server == victory? I filed bug 78277 for this. After the reboot dropping a ~72G ibd file that had been using hole-punch took ~3 minutes. Then I created an 80G file and dropping that took 10 seconds. It a good idea to have database files that take minutes to drop given that InnoDB and filesystem state can get out of sync during a crash requiring manual repair.

And more

I have two CentOS 6.6 servers with the 3.10.53 kernel and XFS. The host in the previous section doesn't use partitioning. The host in this section uses partitioning and transparent page compression. They both get InnoDB deadlocks but this host was healthy enough the the InnoDB background thread was able to kill the server. This was triggered by a DROP DATABASE statement. I don't have thread stacks but will guess that a file unlink operation took too long or got stuck. Because DDL isn't transactional the data dictionary isn't in a good state at this point. Some of the per-partition ibd files are missing.

Reboot #2 has arrived. Did kill -9 on mysqld and the process is still there in state Z after 40 minutes. Delete the database directory but space is still in use according to df. I assume that space won't be released until the zombie process goes away. I give up on trying to use transparent compression on this host.

CPU-bound sysbench on a large server: Postgres 12 to 19 beta1

This has results from sysbench on a small server with Postgres versions 12 through 19 beta1. Sysbench is run with high concurrency (40 conne...