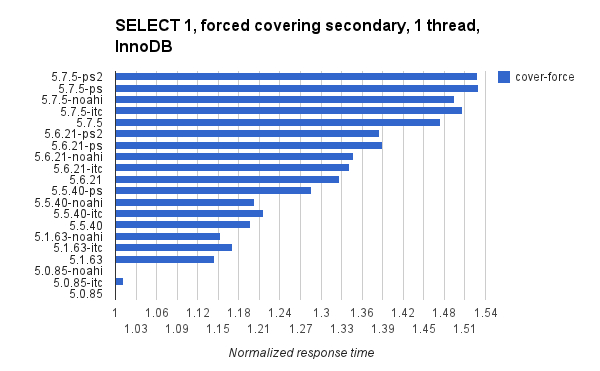
- Response time for 5.7.5 is 1.47X worse without the PS and 1.51X worse with the PS
- Response time for 5.6.21 is 1.37X worse without the PS and 1.43X worse with the PS
- Response time for 5.5.40 is 1.26X worse without the PS and 1.34X worse with the PS
I start with the results. For more details on the configuration of mysqlslap and mysqld see the end of this post. The test was done for 5 types of queries (PK, PK-force, cover-noforce, nocover-force, cover-noforce) and those are described at the end of this post. Results are presented at 1, 4, and 32 threads for InnoDB & Heap engines so there are 6 configurations. In each chart I present normalized response times where the base case is the response time at 1 thread for that query type & storage engine. I used a test server with 40 hyperthread cores.
I updated this on Monday, October 6 with results for adaptive hash index disabled ($binary-noahi) and innodb_thread_concurrency=32 ($binary-itc). All graphs were regenerated.
I updated this on Monday, October 6 with results for adaptive hash index disabled ($binary-noahi) and innodb_thread_concurrency=32 ($binary-itc). All graphs were regenerated.
innodb 1-thread
This shows the gradual increase in response times from in each major release. It also shows the overhead from the PS. All times are normalized using the 1-thread result from 5.0.85 for the PK query as that was the fastest.
The next 3 charts show the change per query type. At one thread all changes: enabling perf schema, innodb_thread_concurrency=32 and adaptive_hash_index=0 make response time worse.
innodb 4-threads
This graph is from the test with 4-threads (mysqlslap --concurrency=4). Results are still normalized to the single-thread result for MySQL 5.0.85 so results here are expected to look a bit worse than the 1-thread graph. But 5.0.85 is still the champ.
The next 3 charts show the change per query type. At 4 threads all changes: enabling perf schema, innodb_thread_concurrency=32 and adaptive_hash_index=0 make response time worse.
innodb 32-threads
Again the base case is the single-thread response time for the same query type and InnoDB. At last, new releases beat 5.0.85. I cut the vertical axis at 10 and the number that runs off the top is from 5.0.85. But this isn't a result at low concurrency.
And this makes it much easier to see how bad the result was for 5.0.85 at high concurrency. Unfortunately that also makes it harder to see differences between other releases. Below are two graphs for each query type. One without a limit on the x-axis, one with a limit to show the differences between new releases. At 32 threads all changes: enabling perf schema, innodb_thread_concurrency=32 and adaptive_hash_index=0 make response time worse.
heap
For the Heap engine I only provide 1 graph per thread count. This blog post is getting long. The pattern here is similar to the results for InnoDB. I don't show results for the cover-noforce query and filed bug 74198 because it gets a bad query plan.

setup
The create file for mysqlslap used the following pattern. At the end there were 64,000 rows in the table, with a PK on column i and secondary indexes on (j) and (j,k).
create table foo (i int primary key auto_increment, j int, k int, l int) engine=innodb;
insert into foo values (null,0,0,0),(null,0,0,0),(null,0,0,0),(null,0,0,0),(null,0,0,0),(null,0,0,0),(null,0,0,0),(null,0,0,0),(null,0,0,0),(null,0,0,0);
<repeat 99 more times to get 1000 rows inserted>
insert into foo select null,0,0,0 from foo;
insert into foo select null,0,0,0 from foo;
insert into foo select null,0,0,0 from foo;
insert into foo select null,0,0,0 from foo;
insert into foo select null,0,0,0 from foo;
insert into foo select null,0,0,0 from foo;
update foo set j=i, k=i;
create index xj on foo(j);
create index xjk on foo(j,k);
There were 5 query types for the test. All fetch 1 row by an equality predicate. Each query was run 100,000 times per thread (--number-of-queries=100000).
- PK - predicate matches PK index
- PK-force - like PK, but also use FORCE INDEX hint
- cover-noforce - predicate matches covering secondary index
- nocover-force - predicate matches non-covering secondary index
- cover-force - like cover-noforce, but also use FORCE INDEX hint
The query text is listed below:
# PK
select j from foo where i = 100;
select j from foo where i = 100;
# PK-force
select j from foo FORCE INDEX(`PRIMARY`) where i = 100;
# cover-noforce
select k from foo where j = 100;
# nocover-force
select k from foo FORCE INDEX(`xj`) where j = 100;
# cover-force
select k from foo FORCE INDEX(`xjk`) where j = 100;
The mysqld configuration is similar to what I used in a previous test but buffers were smaller. This is the 5.7.5 configuration and then it was adjusted to work with older versions and to enable the performance schema.
sql_mode=NO_ENGINE_SUBSTITUTION,STRICT_TRANS_TABLES
table-definition-cache=1000
table-open-cache=2000
table-open-cache-instances=8
max_connections=20000
key_buffer_size=200M
metadata_locks_hash_instances=256
query_cache_size=0
query_cache_type=0
server_id=9
performance_schema=0
binlog_format=row
skip_log_bin
innodb_buffer_pool_instances=8
innodb_io_capacity=1000
innodb_lru_scan_depth=1000
innodb_checksum_algorithm=CRC32
innodb_thread_concurrency=0
innodb_buffer_pool_size=2G
innodb_log_file_size=1900M
innodb_flush_log_at_trx_commit=2
innodb_doublewrite=0
innodb_flush_method=O_DIRECT
innodb_thread_concurrency=0
innodb_max_dirty_pages_pct=80
innodb_file_format=barracuda
innodb_file_per_table
datadir=/data/orig575/var


No comments:
Post a Comment