The results from yesterday used iostat to measure how much InnoDB writes to storage. The results from today use the counters on the storage device and the data from iostat. The total writes reported by the storage device will be larger than the value reported by iostat because flash GC runs in the background to make flash blocks ready for writing. The ratio of device writes divided by iostat writes is the flash WAF (write amplification factor) and is >= 1.
On my storage device the flash WAF is much larger with InnoDB than with MyRocks. The flash WAF is about 1.4X for compressed InnoDB, 1.7X for uncompressed InnoDB and 1.03X for MyRock. This means that InnoDB writes between 11X and 18X more to storage per query compared to MyRocks. This is a huge difference which can force you to use high endurance flash for InnoDB when low endurance is sufficient for MyRocks. It can also force you to replace your storage device faster than desired. Note that excessive over-provisioning is similar to early replacement -- in both cases you buy more devices.
Configuration
All tests were run with the device about 72% full as flash WAF is also a function of device fullness. I started with the database from yesterday's result so the query step had run for 24 hours. I then added data to make each storage device about 72% full. Finally I ran 24 1-hour query steps and use the data from the 47th 1-hour query step reported in the table below.
- Column 1 is the data written in GB per iostat
- Column 2 is the data written in GB per the storage device counters
- Column 3 is the flash WAF (column 2 / column 1)
- Column 4 is the relative write rate per iostat: column 1 divided by RocksDB column 1
- Column 5 is the relative write rate per storage device counters: column 4 * column 3
total GB written relative KB written/query
iostat device WAF iostat device
rocksdb.zlib 108.1 111.3 1.03 1.00 1.03
orig5626.zlib 492.6 670.0 1.36 8.51 11.57
orig5710.zlib 526.4 729.3 1.39 8.53 11.85
orig5626.none 723.2 1200.4 1.66 10.64 17.66
orig5710.none 640.9 1055.8 1.65 10.71 17.67
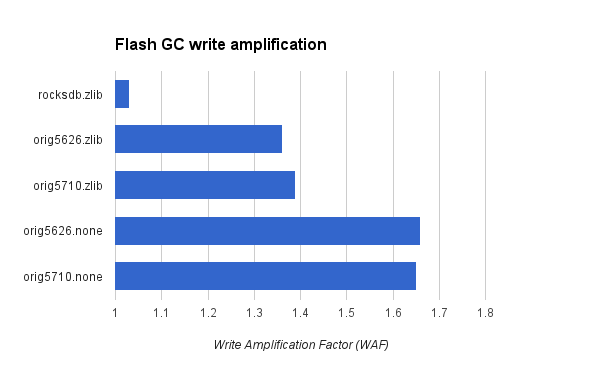
This chart displays the flash WAF per engine using the data from column 3 in the table above.

Hi Mark, very useful post! Thank you.
ReplyDeleteWere the "device IO stats" obtained from SSD SMART logs?
I used a tool provided by the SSD vendor
Delete