Monday, October 6, 2014

Details on range scan performance regression in MySQL 5.7

My last blog post was too long to explain performance regressions for range scans with InnoDB in MySQL 5.7.
  • For a secondary index a non-covering scan degrades much more at high-concurrency than a covering scan. The problem gets worse as the scan length increases. This problem isn't new in 5.7 but it is much worse in 5.7 versus 5.6. At 32 threads the problem is waits on btr_search_latch and hash_table_locks. I opened bug 74283 for this.
  • A covering scan of a secondary index degrades much more at high-concurrency than a PK scan. This problem is equally bad in 5.7 and 5.6. Wait times reported by the performance schema do not explain the problem -- search below for PFS_NOT_INSTRUMENTED to understand why. Using Linux perf I definitely see more mutex contention in the covering index scan. But I don't understand the internal differences between PK and covering secondary index scans. I opened bug 74280 for this.
non-covering vs covering

These graphs show the absolute response time in seconds, not the normalized response time as used in my previous posts. The response time difference between non-covering and covering secondary index scans is much larger at high-concurrency than at low-concurrency. For the 10-row scan the non-covering index is close to the covering index response time at 1 thread but at 32 threads it is almost 2X worse. For the 1000-row scan the non-covering index is about 2X worse at 1 thread and then at 32 threads is about 8X worse in 5.6 and about 13X worse in 5.7. From the PS data that follows the problem is much more wait time on btr_search_latch and hash_table_locks.


covering vs PK

These graphs show absolute response time for the 1000-row scan using MySQL 5.6 and 5.7. There is not much difference in response time between the PK and covering secondary index scans at 1 thread. There is a big difference at 32 threads. 
Performance Schema

Assuming the problem is mutex contention then we have to perfect tool to diagnose the problem -- the Performance Schema. I enabled it to instrument wait/synch/% objects and the results are interesting. I ran the scan tests at 32 threads for the q1, q4 and q5 range scans (q1 is PK, q4 is non-covering secondary, q5 is covering secondary). Tests were done for 10-row and 1000-row scans with the adaptive hash enabled and then disabled. For each configuration the top-10 wait events are listed below. Note that the q4 query runs for much more time than both q1 and q5 and that q5 runs for about 2X longer than q1. I have not normalized the wait times to account for that.

It took the following amount of time to finish the tests
  • adaptive hash on, 10 rows: 23, 35, 23 seconds for q1, q4, q5
  • adaptive hash off, 10 rows: 23, 36, 23 seconds for q1, q4, q5
  • adaptive hash on, 1000 rows: 173, 3540, 237 seconds for q1, q4, q5
  • adaptive hash off, 1000 rows: 137, 3440, 254 seconds for q1, q4, q5

10-row PK scan at 32 threads, adaptive hash index enabled

This is the base case. It was about as fast as the covering index scan.

Seconds    Event
7.50       wait/synch/sxlock/innodb/hash_table_locks
2.57       wait/synch/rwlock/sql/LOCK_grant
2.51       wait/synch/mutex/innodb/fil_system_mutex
2.48       wait/synch/mutex/sql/THD::LOCK_query_plan
1.56       wait/synch/mutex/sql/THD::LOCK_thd_data
1.21       wait/synch/mutex/sql/LOCK_table_cache
1.20       wait/synch/sxlock/innodb/btr_search_latch
0.84       wait/synch/mutex/sql/THD::LOCK_thd_query
0.76       wait/synch/mutex/innodb/trx_pool_mutex
0.75       wait/synch/sxlock/innodb/index_tree_rw_lock

10-row covering scan at 32 threads, adaptive hash index enabled

Compared to the 10-row PK scan, this has:

  • More wait time on btr_search_latch (3.89 vs 1.20 seconds)

Seconds    Event
7.49       wait/synch/sxlock/innodb/hash_table_locks
3.89       wait/synch/sxlock/innodb/btr_search_latch
2.69       wait/synch/mutex/sql/THD::LOCK_query_plan
2.60       wait/synch/mutex/innodb/fil_system_mutex
2.37       wait/synch/rwlock/sql/LOCK_grant
1.45       wait/synch/mutex/sql/THD::LOCK_thd_data
1.22       wait/synch/mutex/sql/LOCK_table_cache
0.88       wait/synch/mutex/sql/THD::LOCK_thd_query
0.74       wait/synch/sxlock/innodb/index_tree_rw_lock
0.68       wait/synch/mutex/innodb/trx_pool_mutex

10-row non-covering scan at 32 threads, adaptive hash index enabled

Compared to the 10-row covering scan, this has:
  • Much more wait time on btr_search_latch (15.60 vs 3.89 seconds)
  • A bit more time on hash_table_locks (9.16 vs 7.49 seconds)
  • A bit less time on LOCK_grant and fil_system_mutex (~1.5 vs ~2.5 seconds)
Seconds    Event
15.60      wait/synch/sxlock/innodb/btr_search_latch
 9.16      wait/synch/sxlock/innodb/hash_table_locks
 2.75      wait/synch/mutex/sql/THD::LOCK_query_plan
 1.54      wait/synch/mutex/innodb/fil_system_mutex
 1.47      wait/synch/mutex/sql/THD::LOCK_thd_data
 1.42      wait/synch/rwlock/sql/LOCK_grant
 1.15      wait/synch/mutex/sql/LOCK_table_cache
 0.96      wait/synch/mutex/sql/THD::LOCK_thd_query
 0.84      wait/synch/sxlock/innodb/index_tree_rw_lock
 0.71      wait/synch/mutex/innodb/trx_pool_mutex

10-row PK scan at 32 threads, adaptive hash index disabled

This is the base case. It was about as fast as the covering index scan whether or not the adaptive hash index was enabled.

Seconds    Event
8.47       wait/synch/sxlock/innodb/hash_table_locks
2.65       wait/synch/rwlock/sql/LOCK_grant
2.58       wait/synch/mutex/innodb/fil_system_mutex
2.42       wait/synch/mutex/sql/THD::LOCK_query_plan
1.52       wait/synch/mutex/sql/THD::LOCK_thd_data
1.25       wait/synch/sxlock/innodb/index_tree_rw_lock
1.17       wait/synch/mutex/sql/LOCK_table_cache
0.87       wait/synch/mutex/sql/THD::LOCK_thd_query
0.65       wait/synch/mutex/innodb/trx_pool_mutex
0.08       wait/io/file/innodb/innodb_data_file

10-row covering scan at 32 threads, adaptive hash index disabled

The waits here are similar to the PK scan.

Seconds    Event
8.53       wait/synch/sxlock/innodb/hash_table_locks
2.67       wait/synch/rwlock/sql/LOCK_grant
2.54       wait/synch/mutex/innodb/fil_system_mutex
2.47       wait/synch/mutex/sql/THD::LOCK_query_plan
1.52       wait/synch/mutex/sql/LOCK_table_cache
1.44       wait/synch/mutex/sql/THD::LOCK_thd_data
1.25       wait/synch/sxlock/innodb/index_tree_rw_lock
0.93       wait/synch/mutex/sql/THD::LOCK_thd_query
0.68       wait/synch/mutex/innodb/trx_pool_mutex
0.08       wait/io/file/innodb/innodb_data_file

10-row non-covering scan at 32 threads, adaptive hash index disabled

Compared to the covering index scan, this has:
  • Much more time in hash_table_locks (30.97 vs 8.53 seconds)
  • Much more time in index_tree_rw_lock (8.80 vs 1.25 seconds)

Seconds    Event
30.97      wait/synch/sxlock/innodb/hash_table_locks
 8.80      wait/synch/sxlock/innodb/index_tree_rw_lock
 2.76      wait/synch/mutex/sql/THD::LOCK_query_plan
 2.14      wait/synch/rwlock/sql/LOCK_grant
 2.12      wait/synch/mutex/innodb/fil_system_mutex
 1.46      wait/synch/mutex/sql/THD::LOCK_thd_data
 1.24      wait/synch/mutex/sql/LOCK_table_cache
 1.00      wait/synch/mutex/sql/THD::LOCK_thd_query
 0.66      wait/synch/mutex/innodb/trx_pool_mutex
 0.08      wait/io/file/innodb/innodb_data_file

1000-row PK scan at 32 threads, adaptive hash index enabled

This is the base case.

Seconds    Event
8.21       wait/synch/sxlock/innodb/hash_table_locks
3.13       wait/synch/mutex/sql/THD::LOCK_query_plan
1.57       wait/synch/mutex/sql/THD::LOCK_thd_data
1.08       wait/synch/mutex/sql/LOCK_table_cache
1.04       wait/synch/mutex/sql/THD::LOCK_thd_query
0.69       wait/synch/rwlock/sql/LOCK_grant
0.66       wait/synch/mutex/innodb/trx_pool_mutex
0.64       wait/synch/sxlock/innodb/btr_search_latch
0.62       wait/synch/mutex/innodb/fil_system_mutex
0.60       wait/synch/sxlock/innodb/index_tree_rw_lock

1000-row covering scan at 32 threads, adaptive hash index enabled

This is about 1.4X slower than the PK scan at 1000 rows. The waits here are about the same as the PK case but the top wait event, hash_table_locks, is less here than in the PK scan. There isn't a wait event that explains the difference in performance. Perhaps the difference comes from CPU instructions or cache misses. The reason why the PS doesn't explain the difference is that the per-block rw-lock doesn't use the PS, from buf_block_init() there is this code:
   rw_lock_create(PFS_NOT_INSTRUMENTED, &block->lock, SYNC_LEVEL_VARYING);


Seconds    Event
6.45       wait/synch/sxlock/innodb/hash_table_locks
3.22       wait/synch/mutex/sql/THD::LOCK_query_plan
1.52       wait/synch/mutex/sql/THD::LOCK_thd_data
1.00       wait/synch/mutex/sql/THD::LOCK_thd_query
0.93       wait/synch/mutex/sql/LOCK_table_cache
0.72       wait/synch/mutex/innodb/trx_pool_mutex
0.70       wait/synch/sxlock/innodb/btr_search_latch
0.65       wait/synch/mutex/innodb/fil_system_mutex
0.63       wait/synch/rwlock/sql/LOCK_grant
0.56       wait/synch/sxlock/innodb/index_tree_rw_lock

1000-row non-covering scan at 32 threads, adaptive hash index enabled

This is 15 to 20 times slower than the PK and covering index scans. Compared to the covering index scan this has:
  • Much more time in btr_search_latch (655.57 vs 0.70 seconds)
  • Much more time in hash_table_locks (35.47 vs 6.45 seconds)
  • Much more time in index_tree_rw_lock (9.68 vs 0.56 seconds)
Seconds    Event
655.57     wait/synch/sxlock/innodb/btr_search_latch
 35.47     wait/synch/sxlock/innodb/hash_table_locks
  9.68     wait/synch/sxlock/innodb/index_tree_rw_lock
  3.42     wait/synch/mutex/sql/THD::LOCK_query_plan
  1.65     wait/synch/mutex/sql/THD::LOCK_thd_data
  1.26     wait/synch/mutex/sql/THD::LOCK_thd_query
  0.86     wait/synch/mutex/sql/LOCK_table_cache
  0.74     wait/synch/mutex/innodb/trx_pool_mutex
  0.73     wait/synch/rwlock/sql/LOCK_grant
  0.43     wait/synch/mutex/innodb/fil_system_mutex

1000-row PK scan at 32 threads, adaptive hash index disabled

This is the base case.

Seconds    Event
9.80       wait/synch/sxlock/innodb/hash_table_locks
3.00       wait/synch/mutex/sql/THD::LOCK_query_plan
1.53       wait/synch/mutex/sql/THD::LOCK_thd_data
1.13       wait/synch/sxlock/innodb/index_tree_rw_lock
1.05       wait/synch/mutex/sql/LOCK_table_cache
1.02       wait/synch/mutex/sql/THD::LOCK_thd_query
0.79       wait/synch/mutex/innodb/trx_pool_mutex
0.64       wait/synch/rwlock/sql/LOCK_grant
0.58       wait/synch/mutex/innodb/fil_system_mutex
0.08       wait/io/file/innodb/innodb_data_file

1000-row covering scan at 32 threads, adaptive hash index disabled

This is about 2X slower than the PK scan at 1000 rows. The waits here are about the same as the PK case but the top wait event, hash_table_locks, is less here than in the PK scan. There isn't a wait event that explains the difference in performance. Perhaps the difference comes from CPU instructions or cache misses.

Seconds    Event
8.14       wait/synch/sxlock/innodb/hash_table_locks
3.00       wait/synch/mutex/sql/THD::LOCK_query_plan
1.51       wait/synch/mutex/sql/THD::LOCK_thd_data
0.99       wait/synch/sxlock/innodb/index_tree_rw_lock
0.99       wait/synch/mutex/sql/THD::LOCK_thd_query
0.95       wait/synch/mutex/sql/LOCK_table_cache
0.77       wait/synch/mutex/innodb/trx_pool_mutex
0.66       wait/synch/rwlock/sql/LOCK_grant
0.62       wait/synch/mutex/innodb/fil_system_mutex
0.08       wait/io/file/innodb/innodb_data_file

1000-row non-covering scan at 32 threads, adaptive hash index disabled

Wow, compared to the covering index scan this has:

  • Much more wait time on hash_table_locks (1434.73 vs 8.14 seconds)
  • Much more time on index_tree_rw_lock (659.07 vs 0.99 seconds)

Seconds    Event
1434.73    wait/synch/sxlock/innodb/hash_table_locks
 659.07    wait/synch/sxlock/innodb/index_tree_rw_lock
   3.25    wait/synch/mutex/sql/THD::LOCK_query_plan
   1.51    wait/synch/mutex/sql/THD::LOCK_thd_data
   0.97    wait/synch/mutex/sql/THD::LOCK_thd_query
   0.87    wait/synch/mutex/sql/LOCK_table_cache
   0.71    wait/synch/mutex/innodb/trx_pool_mutex
   0.67    wait/synch/rwlock/sql/LOCK_grant
   0.44    wait/synch/mutex/innodb/fil_system_mutex
   0.08    wait/io/file/innodb/innodb_data_file

Missing time?

I am trying to explain why the 1000-row covering index scan is slower than the PK scan. Output from the performance schema doesn't explain the difference. Perhaps the PS isn't instrumenting something. Looking at non-hierarchical output from perf I see a difference. This is from the PK scan:

     8.58%   mysqld  mysqld                [.] row_search_mvcc(...)                                     
     8.00%   mysqld  mysqld                [.] ut_delay(unsigned long)                
     4.87%   mysqld  mysqld                [.] rec_get_offsets_func(...)
     3.50%   mysqld  mysqld                [.] mtr_t::Command::release_all(
     3.12%   mysqld  libc-2.14.1.so        [.] __memcpy_ssse3_back
     3.02%   mysqld  mysqld                [.] TTASEventMutex<TrackPolicy>::spin_and_wait(...)
     2.94%   mysqld  mysqld                [.] buf_page_optimistic_get(...)
     2.50%   mysqld  mysqld                [.] ha_innobase::general_fetch(...)

And this is from the covering index scan. For the secondary index scan the top two CPU consumers are the mutex busy wait loop. So there is mutex contention that isn't reported by the performance schema.

    24.30%   mysqld  mysqld                [.] ut_delay(unsigned long)
    16.51%   mysqld  mysqld                [.] TTASEventMutex<TrackPolicy>::spin_and_wait(...)
     4.54%   mysqld  mysqld                [.] mtr_t::Command::release_all()
     4.51%   mysqld  mysqld                [.] row_search_mvcc(...)
     2.70%   mysqld  mysqld                [.] _ZL22pfs_rw_lock_s_lock_lowP9rw_lock_tmPKcm.isra.17
     2.25%   mysqld  libc-2.14.1.so        [.] __memcpy_ssse3_back
     2.15%   mysqld  mysqld                [.] buf_page_optimistic_get(...)
     2.03%   mysqld  mysqld                [.] rec_get_offsets_func(...)

From hierarchical perf output this is the result for the PK scan:

     8.55%   mysqld  mysqld                [.] row_search_mvcc(...)
             |
             --- row_search_mvcc(...)
                |          
                |--99.11%-- ha_innobase::general_fetch(unsigned char*, unsigned int, unsigned int)
                |          handler::ha_index_next(unsigned char*)
                |          handler::read_range_next()
                |          handler::multi_range_read_next(char**)
                |          QUICK_RANGE_SELECT::get_next()
                |          _ZL8rr_quickP11READ_RECORD
                |          sub_select(JOIN*, QEP_TAB*, bool)
                |          JOIN::exec()
                |          mysql_select(...)
                |          handle_select(THD*, select_result*, unsigned long)
                |          _ZL21execute_sqlcom_selectP3THDP10TABLE_LIST
                |          mysql_execute_command(THD*)
                |          mysql_parse(THD*, Parser_state*)
                |          dispatch_command(enum_server_command, THD*, char*, unsigned long)
                |          handle_connection
                |          pfs_spawn_thread
                |          start_thread
                |          __clone
                |          
                |--0.54%-- ha_innobase::index_read(...)
                |          handler::ha_index_read_map(...)
                |          handler::read_range_first(st_key_range const*, st_key_range const*, bool, bool)
                |          handler::multi_range_read_next(char**)
                |          QUICK_RANGE_SELECT::get_next()
                |          _ZL8rr_quickP11READ_RECORD
                |          sub_select(JOIN*, QEP_TAB*, bool)
                |          JOIN::exec()
                |          mysql_select(...)
                |          handle_select(THD*, select_result*, unsigned long)
                |          _ZL21execute_sqlcom_selectP3THDP10TABLE_LIST
                |          mysql_execute_command(THD*)
                |          mysql_parse(THD*, Parser_state*)
                |          dispatch_command(enum_server_command, THD*, char*, unsigned long)
                |          handle_connection
                |          pfs_spawn_thread
                |          start_thread
                |          __clone
                 --0.34%-- [...]

     7.96%   mysqld  mysqld                [.] ut_delay(unsigned long)
             |
             --- ut_delay(unsigned long)
                |          
                |--99.96%-- _ZN11PolicyMutexI14TTASEventMutexI11TrackPolicyEE5enterEmmPKcm.constprop.95
                |          |          
                |          |--99.85%-- buf_page_optimistic_get(...)
                |          |          btr_cur_optimistic_latch_leaves(...)
                |          |          btr_pcur_restore_position_func(...)
                |          |          _ZL30sel_restore_position_for_mysqlPmmP10btr_pcur_tmP5mtr_t.constprop.75
                |          |          row_search_mvcc(...)
                |          |          ha_innobase::general_fetch(unsigned char*, unsigned int, unsigned int)
                |          |          handler::ha_index_next(unsigned char*)
                |          |          handler::read_range_next()
                |          |          handler::multi_range_read_next(char**)
                |          |          QUICK_RANGE_SELECT::get_next()
                |          |          _ZL8rr_quickP11READ_RECORD
                |          |          sub_select(JOIN*, QEP_TAB*, bool)
                |          |          JOIN::exec()
                |          |          mysql_select(...)
                |          |          handle_select(THD*, select_result*, unsigned long)
                |          |          _ZL21execute_sqlcom_selectP3THDP10TABLE_LIST
                |          |          mysql_execute_command(THD*)
                |          |          mysql_parse(THD*, Parser_state*)
                |          |          dispatch_command(enum_server_command, THD*, char*, unsigned long)
                |          |          handle_connection
                |          |          pfs_spawn_thread
                |          |          start_thread
                |          |          __clone
                |           --0.15%-- [...]
                 --0.04%-- [...]

Which looks very different from the result for the covering index scan:

    24.49%   mysqld  mysqld                [.] ut_delay(unsigned long)
             |
             --- ut_delay(unsigned long)
                |          
                |--99.98%-- _ZN11PolicyMutexI14TTASEventMutexI11TrackPolicyEE5enterEmmPKcm.constprop.95
                |          |          
                |          |--98.79%-- buf_page_optimistic_get(...)
                |          |          btr_cur_optimistic_latch_leaves(...)
                |          |          btr_pcur_restore_position_func(...)
                |          |          _ZL30sel_restore_position_for_mysqlPmmP10btr_pcur_tmP5mtr_t.constprop.75
                |          |          row_search_mvcc(...)
                |          |          ha_innobase::general_fetch(unsigned char*, unsigned int, unsigned int)
                |          |          handler::ha_index_next(unsigned char*)
                |          |          handler::read_range_next()
                |          |          handler::multi_range_read_next(char**)
                |          |          QUICK_RANGE_SELECT::get_next()
                |          |          _ZL8rr_quickP11READ_RECORD
                |          |          sub_select(JOIN*, QEP_TAB*, bool)
                |          |          JOIN::exec()
                |          |          mysql_select(...)
                |          |          handle_select(THD*, select_result*, unsigned long)
                |          |          _ZL21execute_sqlcom_selectP3THDP10TABLE_LIST
                |          |          mysql_execute_command(THD*)
                |          |          mysql_parse(THD*, Parser_state*)
                |          |          dispatch_command(enum_server_command, THD*, char*, unsigned long)
                |          |          handle_connection
                |          |          pfs_spawn_thread
                |          |          start_thread
                |          |          __clone

    16.22%   mysqld  mysqld                [.] TTASEventMutex<TrackPolicy>::spin_and_wait(...)
             |
             --- TTASEventMutex<TrackPolicy>::spin_and_wait(...)
                |          
                |--99.71%-- _ZN11PolicyMutexI14TTASEventMutexI11TrackPolicyEE5enterEmmPKcm.constprop.95
                |          |          
                |          |--98.90%-- buf_page_optimistic_get(...)
                |          |          btr_cur_optimistic_latch_leaves(...)
                |          |          btr_pcur_restore_position_func(...)
                |          |          _ZL30sel_restore_position_for_mysqlPmmP10btr_pcur_tmP5mtr_t.constprop.75
                |          |          row_search_mvcc(...)
                |          |          ha_innobase::general_fetch(unsigned char*, unsigned int, unsigned int)
                |          |          handler::ha_index_next(unsigned char*)
                |          |          handler::read_range_next()
                |          |          handler::multi_range_read_next(char**)
                |          |          QUICK_RANGE_SELECT::get_next()
                |          |          _ZL8rr_quickP11READ_RECORD
                |          |          sub_select(JOIN*, QEP_TAB*, bool)
                |          |          JOIN::exec()
                |          |          mysql_select(...)
                |          |          handle_select(THD*, select_result*, unsigned long)
                |          |          _ZL21execute_sqlcom_selectP3THDP10TABLE_LIST
                |          |          mysql_execute_command(THD*)
                |          |          mysql_parse(THD*, Parser_state*)
                |          |          dispatch_command(enum_server_command, THD*, char*, unsigned long)
                |          |          handle_connection
                |          |          pfs_spawn_thread
                |          |          start_thread
                |          |          __clone

Impact from adaptive hash index and innodb_thread_concurrency in MySQL 5.7.5

I have been evaluating micro-benchmark results for point and range queries in MySQL 5.7, 5.6, 5.5, 5.1 and 5.0. In this post I document the impact from disabling the InnoDB adaptive hash index and using innodb_thread_concurrency. Context matters and in this case the database is cached with a small working set (between 1 and 1000 rows) with 1 to 32 concurrent queries on a server with 40 hyperthread cores that is shared by mysqld and the client (mysqlslap). I did not test the case where when the client concurrency exceeds the number of CPU cores and the results there might not match mine here.

The workload includes point queries and index range scans. For each there are three query types. The first uses a PK (q1), the second uses a non-covering secondary index (q4) and the third uses a covering secondary index (q5). The range scans are done for LIMIT 10 and LIMIT 1000. These queries were used in my previous blog posts on 5.7 performance.

My summary is that for this workload there isn't much risk from using innodb_thread_concurrency, although I prefer to continue to make InnoDB efficient on multi-core so we can forget about that option. Not using the adaptive hash index can greatly increase response time for queries that do a lot of work (in this case "a lot" meant 1000 or 2000 index searches) even at high concurrency. We need to make it more efficient on multi-core. I know the InnoDB team can do it, given they previously sharded the buffer pool.

In what follows I use itc to name binary with innodb_thread_concurrency=32, innodb_concurrency_tickets=500 and noahi to name the binary with innodb_adaptive_hash_index=0. More detail on the binaries used and the test configuration is in the previous posts on point and range queries linked above.

The results time below are normalized. Each result shows the value of A/B where A is the response time for MySQL 5.7.5 with a given configuration and query (noahi-q4 for example) and B is the response time for the same query and MySQL 5.7.5 with the base configuration (adaptive hash index enabled, innodb_thread_concurrency=0).

point queries

The overhead for the itc binaries is between +/- 1% for all but one of the cases. The overhead for the noahi binaries is similar except for q1 (point query on PK) where it is between 2.5% and 3.5%. This is a good result to me, assuming there is a benefit for another workload, in that things don't get much worse.


10-row scan

This has results for the 10-row range scan (queries q1, q4 and q5 described above). The overhead for the itc binaries ranges from -2% (good) to +1% (bad). That isn't significant to me assuming there is a benefit for other workloads. For the ahi binaries the overhead is no more than +1% for q1 and q5. But for q4 the overhead is about +8% at 1 thread and +12% at 4 threads. That might be too much. Note that this query does much more work by doing a PK search to get missing columns for each of the 10 entries fetched from the secondary index.


1000 row scan


There are two graphs for the 1000-row range scan. The second graph has the y-axis truncated at 1.15 so the large value for noahi-q4 doesn't hide everything else. Note that the itc binary uses innodb_concurrency_tickets=500 and the query fetches 1000 rows so it will have to fetch more tickets at least once per query. While the default for tickets has increased from 500 to 5000 in recent releases, I can construct a test case that fetches more than 5000 rows. The itc binaries have an overhead between +3% and +10% at 32 threads, and the overhead is much higher at 32 threads then at 1 or 2. The noahi binaries have a huge overhead for q4 that decreases with concurrency, from 1.75X down to 1.02X. This shows the benefit of the adaptive hash index for queries that do many index searches. For other queries (q1 and q5) there was a small benefit from using noahi except for q5 at 32 threads.


Saturday, October 4, 2014

Low-concurrency performance for range queries: MySQL 5.7 vs previous releases

This is my third post on low-concurrency performance regressions in MySQL 5.7.5 and the focus here is on short range scans. Previous posts were on point queries and sql-bench. This explains performance for 10 and 1000 row index range scans with InnoDB. MySQL 5.7.5 is between 1.49X and 1.63X slower than 5.0.85 for the tested queries with 10 row range scans. It is between 1.37X and 2.67X slower than 5.0.85 for the tested queries with 1000 row range scans. I will save the analysis for another blog post but covering secondary index scans do worse than  PK scans at high concurrency and non-covering secondary queries do the worst. Note also the huge improvement for InnoDB 5.6 and 5.7 at high concurrency. This is old news by now, but always nice to see.

I updated this blog post on Sunday, Oct 5 after first publishing it on Saturday, Oct 4. I added results for all versions with the InnoDB adaptive hash index disabled. I also corrected results for the setup that used innodb_thread_concurrency as my first round of results didn't really enable it. All graphs have been regenerated. But I don't write much about the new results here. That waits for another blog post.

I did similar testing for MySQL 5.6 in 2013 and opened bugs 68825 (Apr 2013) and 69236 (May 2013). They are still open and the regressions still exist in 5.6 and 5.7. Those bug reports are not specific enough to describe all of the sources of regression. A lot more work is required to explain the problem. I have yet to do that analysis and it isn't clear to me that others have done it. While I hope to do some of the debugging I also hope to motivate upstream to expand their public benchmark effort beyond high-concurrency workloads (replication and low-concurrency are also critical). This can't be a one time effort. Potential regressions arrive with each new commit to the upstream source repo, but my guess is that most regressions come over many diffs rather than 1 bad diff. On the bright side I think it is possible to automate testing to search for the source of perf regressions.

I have 4 new bug reports so far for 5.7: 74198 for a bad query plan with the Heap engine, 74166 for a compiler error, 74167 for a problem with InnoDB and ext-3 (already fixed in 5.7.6) and 74216 for a documentation improvement. From these tests I think I found a few more performance regressions but will save that for the next blog post.

setup

I use mysqlslap as explained here and tested binaries for MySQL versions 5.0.85, 5.1.61, 5.5.40, 5.6.21 and 5.7.5 as explained here. I tested two additional configuration for each release - one to use innodb_thread_concurrency and the other to disable the adaptive hash index. The innodb_thread_concurrency tests are indicated by ${binary}-itc below and used innodb_thread_concurrency=32 and innodb_concurrency_tickets=500 to understand the impact on queries that need more than 500 tickets, like the LIMIT 1000 queries here.  The other new setup used innodb_adaptive_hash_index=0 to disable the AHI and is indicated by ${binary}-noahi below.

Three different queries were tested and for each type of query the test was repeated with a LIMIT 10, LIMIT 100 and LIMIT 1000 clause to understand the impact from increasing the scan length. I only report results for the LIMIT 10 and LIMIT 1000 cases. The queries were:
  • PK - scan PK index
  • nocover-force - scan non-covering secondary index, fetch missing columns from PK
  • cover-force - scan covering secondary index
This is the text for the queries:
# PK
select j from foo where i >= 100 order by i limit $N;

# nocover-force
select k from foo FORCE INDEX(`xj`) where j >= 100 order by j limit $N;

# cover-force
select k from foo FORCE INDEX(`xjk`) where j >= 100 order by j limit $N;

This is an example command line to run a test with mysqlslap:
mysqlslap --concurrency=$C -h127.0.0.1 --create-schema=test1 --number-of-queries=$Q --create=ddl.sql --query="select j from foo where i >= 1000 order by i limit $N"
results for LIMIT 10

This has results for queries that scan and return 10 rows. In the many graphs that follow the results use the normalized response time (time for query / base case) where the base case is the response time for MySQL 5.0.85 at 1 thread. Tests were repeated for 1, 4 and 32 threads. There are several goals:
  • Show that newer releases of MySQL have a normalized response time close to 1 for the 1-thread test or show the regression.
  • Show that response time doesn't get a lot worse for 4 and 32 threads.
  • Show that newer releases do better than 5.0.85 at 32 threads.
  • Show the overhead from using the PS for short running queries.
results for LIMIT 10 at 1-thread

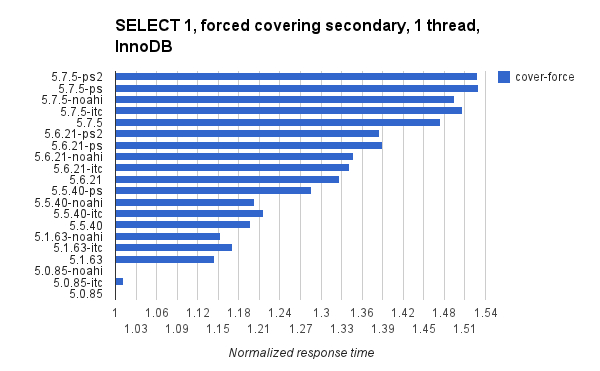
These graphs show the normalized response times for the 10 row scan with 1 client. The two things that stand out for me are:
  1. The regression from 5.6 to 5.7 is much larger than from 5.5 to 5.6. But it isn't that different from the 5.0 to 5.1 regression.
  2. The regression from using the PS in 5.5.40 is large. Fortunately it is smaller in 5.6 and 5.7.


results for LIMIT 10 at 4-threads

Results here are similar to the 1-thread case but there is one difference. Concurrency improvements in recent releases reduce the regression for the non-covering secondary query in the second slide below.


results for LIMIT 10 at 32-threads

Newer MySQL releases are much better than 5.0.85 at 32 threads. Here I use two graphs for each query and one truncates the response time graph to make it easier to see the differences between the newer releases. Note that problems at high concurrency exist in 5.0, 5.1 and 5.5. InnoDB took a huge step forward in 5.6 after taking a step backwards in 5.5.


results for LIMIT 1000 at 1-thread

Now the test switches to a range query that scans & fetches 1000 rows. For the PK and covering secondary scans there is a regression in 5.1 and new releases show steady regressions. For the non-covering index scan performance has not regressed much in new releases.


results for LIMIT 1000 at 4-threads

The LIMIT 1000 query is more sensitive to mutex contention than the LIMIT 10 query so new releases tend to do better than older ones, but there is a regression from 5.6 to 5.7. The non-covering secondary query is even more sensitive to mutex contention.


results for LIMIT 1000 at 32-threads

There must be replication lag in the Google spreadsheet client because the itc binaries below don't have results in the saved images even though they exist on my browser. New releases tend to do better than old releases. But there is a regression in 5.7 for the non-covering secondary index scan. More on that in my next blog post.


Thursday, October 2, 2014

Low-concurrency performance for point lookups: MySQL 5.7.5 vs previous releases

My series on low-concurrency performance continues. Previously I compared results for sql-bench and here I use point queries run by mysqlslap for 1, 4 and 32 concurrent clients to compare MySQL versions 5.0, 5.1, 5.5, 5.6 and 5.7 for the InnoDB and Heap storage engines. All binaries (mysqlslap, mysqld) ran on the same host. The test table has 64,000 rows. The test binaries are described here. Compared to MySQL 5.0.85, for the workload with 1 thread:

  • Response time for 5.7.5 is 1.47X worse without the PS and 1.51X worse with the PS
  • Response time for 5.6.21 is 1.37X worse without the PS and 1.43X worse with the PS
  • Response time for 5.5.40 is 1.26X worse without the PS and 1.34X worse with the PS
I start with the results. For more details on the configuration of mysqlslap and mysqld see the end of this post. The test was done for 5 types of queries (PK, PK-force, cover-noforce, nocover-force, cover-noforce) and those are described at the end of this post. Results are presented at 1, 4, and 32 threads for InnoDB & Heap engines so there are 6 configurations. In each chart I present normalized response times where the base case is the response time at 1 thread for that query type & storage engine. I used a test server with 40 hyperthread cores.

I updated this on Monday, October 6 with results for adaptive hash index disabled ($binary-noahi) and innodb_thread_concurrency=32 ($binary-itc). All graphs were regenerated.

innodb 1-thread

This shows the gradual increase in response times from in each major release. It also shows the overhead from the PS. All times are normalized using the 1-thread result from 5.0.85 for the PK query as that was the fastest.
The next 3 charts show the change per query type. At one thread all changes: enabling perf schema, innodb_thread_concurrency=32 and adaptive_hash_index=0 make response time worse.


innodb 4-threads

This graph is from the test with 4-threads (mysqlslap --concurrency=4). Results are still normalized to the single-thread result for MySQL 5.0.85 so results here are expected to look a bit worse than the 1-thread graph. But 5.0.85 is still the champ.

The next 3 charts show the change per query type. At 4 threads all changes: enabling perf schema, innodb_thread_concurrency=32 and adaptive_hash_index=0 make response time worse.


innodb 32-threads

Again the base case is the single-thread response time for the same query type and InnoDB. At last, new releases beat 5.0.85. I cut the vertical axis at 10 and the number that runs off the top is from 5.0.85. But this isn't a result at low concurrency.

And this makes it much easier to see how bad the result was for 5.0.85 at high concurrency. Unfortunately that also makes it harder to see differences between other releases. Below are two graphs for each query type. One without a limit on the x-axis, one with a limit to show the differences between new releases. At 32 threads all changes: enabling perf schema, innodb_thread_concurrency=32 and adaptive_hash_index=0 make response time worse.


heap

For the Heap engine I only provide 1 graph per thread count. This blog post is getting long. The pattern here is similar to the results for InnoDB. I don't show results for the cover-noforce query and filed bug 74198 because it gets a bad query plan.


setup

The create file for mysqlslap used the following pattern. At the end there were 64,000 rows in the table, with a PK on column i and secondary indexes on (j) and (j,k).


create table foo (i int primary key auto_increment, j int, k int, l int) engine=innodb;
insert into foo values (null,0,0,0),(null,0,0,0),(null,0,0,0),(null,0,0,0),(null,0,0,0),(null,0,0,0),(null,0,0,0),(null,0,0,0),(null,0,0,0),(null,0,0,0);
<repeat 99 more times to get 1000 rows inserted>
insert into foo select null,0,0,0 from foo;
update foo set j=i, k=i;
create index xj on foo(j);
create index xjk on foo(j,k);

There were 5 query types for the test. All fetch 1 row by an equality predicate. Each query was run 100,000 times per thread (--number-of-queries=100000).
  • PK - predicate matches PK index
  • PK-force - like PK, but also use FORCE INDEX hint
  • cover-noforce - predicate matches covering secondary index
  • nocover-force - predicate matches non-covering secondary index
  • cover-force - like cover-noforce, but also use FORCE INDEX hint

The query text is listed below:
# PK
select j from foo where i = 100;

# PK-force
select j from foo FORCE INDEX(`PRIMARY`) where i = 100;

# cover-noforce
select k from foo where j = 100;

# nocover-force
select k from foo FORCE INDEX(`xj`) where j = 100;

# cover-force
select k from foo FORCE INDEX(`xjk`) where j = 100;

The mysqld configuration is similar to what I used in a previous test but buffers were smaller. This is the 5.7.5 configuration and then it was adjusted to work with older versions and to enable the performance schema.

sql_mode=NO_ENGINE_SUBSTITUTION,STRICT_TRANS_TABLES 

table-definition-cache=1000
table-open-cache=2000
table-open-cache-instances=8
max_connections=20000
key_buffer_size=200M
metadata_locks_hash_instances=256 
query_cache_size=0
query_cache_type=0
server_id=9
performance_schema=0

binlog_format=row
skip_log_bin

innodb_buffer_pool_instances=8
innodb_io_capacity=1000
innodb_lru_scan_depth=1000
innodb_checksum_algorithm=CRC32
innodb_thread_concurrency=0
innodb_buffer_pool_size=2G
innodb_log_file_size=1900M
innodb_flush_log_at_trx_commit=2
innodb_doublewrite=0
innodb_flush_method=O_DIRECT
innodb_thread_concurrency=0
innodb_max_dirty_pages_pct=80
innodb_file_format=barracuda
innodb_file_per_table
datadir=/data/orig575/var

Wednesday, October 1, 2014

Single thread performance in MySQL 5.7.5 versus older releases via sql-bench

MySQL 5.7 does much better on benchmarks with high-concurrency. It might do worse on benchmarks with low-concurrency. I am not surprised as this has been true across many releases. The question is whether anything can be done to reverse it. When testing 5.6 I filed bugs 68825 and 69236 for this problem. Maybe it is time for new bug reports. I measure the following from sysbench for InnoDB but must add the disclaimer that I have yet to explain these results and I am wary of unexplained benchmark results. And also note that these overheads are for the sql-bench workload. Your workload might have a smaller overhead. By the same token, if you have less overhead when running TPC-D queries that doesn't mean there isn't a performance regression for short-running queries at low concurrency.
  • First for 5.7.5 compared to 5.0.85
    • 5.7.5 is 1.45X slower than 5.0.85 when the PS is enabled
    • 5.7.5 is 1.33X slower than 5.0.85 when the PS is disabled
    • Enabling PS for 5.7.5 makes it 1.1X slower
  • Next for 5.6.21 compared to 5.0.85
    • 5.6.21 is 1.45X slower than 5.0.85 when the PS is enabled
    • 5.6.21 is 1.16X slower than 5.0.85 when the PS is disabled
    • Enabling PS for 5.6.21 makes it 1.25X slower

I previously compared MySQL 5.6 to older releases to document performance regressions for single-threaded workloads. This is an important workload even if high-concurrency benchmarks get all of the PR. Database reload and replication apply are cases where low-concurrency performance matters a lot. Others have made a similar case for the importance (Percona, Yoshinori).

In this post I present results from sql-bench from the full result and test-wisconsin. I used the same client binary to test all servers -- sql-bench from MySQL 5.5. I think I used the same compiler options and library runtimes for MySQL 5.0, 5.1, 5.5, 5.7 and 5.7. All servers were linked with jemalloc. I tested the following binaries:
  • 5.0.85, 5.1.63, 5.5.40, 5.6.21, 5.7.5 - MySQL with PS disabled in my.cnf when supported
  • 5.5.40-ps, 5.6.21-ps, 5.7.5-ps - MySQL with PS enabled in my.cnf but no instruments configured
  • 5.6.21-ps2, 5.7.5-ps2 - MySQL with PS enabled and performance_schema_instrument="wait/io/%"
soapbox

I think it is odd to publish benchmark results with the PS disabled. It should be enabled for benchmarks with basic instruments configured (rows changed/read/inserted/deleted, IO requests and time per table, similar metrics per user) because the PS does two things -- per user/table monitoring which is always enabled and performance debugging for things like mutex contention which isn't always enabled. There is one time when benchmarks can be run with PS disabled, and that is when searching for the PS overhead.

sql-bench test-wisconsin

This result is from the Wisconsin benchmark included in sql-bench for InnoDB. This shows a gradual increase in response time and 5.7.5 is about 10% slower than 5.0.85. The overhead from the performance schema for this workload is small which matches what I have seen before. The PS overhead can be significant for short running queries but is small for others.

binary        query-seconds
5.0.85           70
5.1.63           70
5.5.40           70
5.5.40-ps        71      
5.6.21           71
5.6.21-ps        73      
5.6.21-ps2       73      
5.7.5            75
5.7.5-ps         77
5.7.5-ps2        77 

sql-bench full test innodb

This is the result from a full run of sql-bench for all of the MySQL versions with InnoDB. The create test is much slower starting in 5.6.21 and most of the overhead is in the create_key+drop subtest. The insert, select and transaction tests get slower gradually from 5.0 to 5.7. Only one test, alter table, got faster from 5.0 to 5.7. There is also a significant penalty (25% in 5.6, 10% in 5.7) from enabling the performance schema but no penalty from using performance_schema_instrument="wait/io/%" after enabling the PS.

binary        total seconds
5.0.85            924
5.1.63            912
5.5.40            919
5.5.40-ps         988
5.6.21           1080
5.6.21-ps        1341
5.6.21-ps2       1339
5.7.5            1231
5.7.5-ps         1343
5.7.5-ps2        1338

This shows the total time relative to the time in seconds for MySQL 5.0.85. Thus the relative time is about 1 for 5.0.85, 5.1.63 and 5.5.40.


This has data for all of the test types excluding wisconsin that takes 5 to 7 seconds.

version alter-table  ATIS  big-tables  connect create  insert  select transact
5.0.85      17        7       5          62      122     528     172     8
5.1.63      16        7       9          63      102     524     179     8
5.5.40      17        7       8          65      101     530     178     9
5.5.40-ps   18        6       8          68      114     579     181     9
5.6.21      18        7       8          64      219     553     196     10
5.6.21-ps   18        7       8          70      406     601     213     11
5.6.21-ps2  18        7       9          66      406     604     212     11
5.7.5       11        8       9          69      264     630     225     11
5.7.5-ps    11        8       9          73      335     660     225     12
5.7.5-ps2   11        8       9          71      332     663     226     12

sql-bench full test MyISAM

I repeated the test for MyISAM with the PS disabled. There continues to be a regression from 5.0.85 to 5.7.5 but it is smaller than the one for InnoDB -- 1.33X versus 1.16X. So the regression isn't limited to InnoDB. Likely suspects are the parser, optimizer and performance schema (which doesn't narrow the problem much).


setup

Command line for test-wisconsin:
 ./test-wisconsin --server=mysql --host=127.0.0.1 --log --create-options="engine=innodb" --loop-count=1000
Command line for full test:

./run-all-tests --server=mysql --host=127.0.0.1 --log --create-options="engine=innodb"
This is the configuration for MySQL 5.7.5 with the PS disabled. A similar my.cnf file was used for other versions with changes as required:

sql_mode=NO_ENGINE_SUBSTITUTION,STRICT_TRANS_TABLES 

table-definition-cache=1000
table-open-cache=2000
table-open-cache-instances=8
max_connections=20000
key_buffer_size=200M
metadata_locks_hash_instances=256 
query_cache_size=0
query_cache_type=0
server_id=9
performance_schema=0

binlog_format=row
skip_log_bin

innodb_buffer_pool_instances=8
innodb_io_capacity=1000
innodb_lru_scan_depth=1000
innodb_checksum_algorithm=CRC32
innodb_thread_concurrency=0
innodb_buffer_pool_size=100G
innodb_log_file_size=1900M
innodb_flush_log_at_trx_commit=2
innodb_doublewrite=0
innodb_flush_method=O_DIRECT
innodb_thread_concurrency=0
innodb_max_dirty_pages_pct=80
innodb_file_format=barracuda
innodb_file_per_table
datadir=/data/orig575/var


CPU-bound sysbench on a large server: Postgres 12 to 19 beta1

This has results from sysbench on a small server with Postgres versions 12 through 19 beta1. Sysbench is run with high concurrency (40 conne...