Are MySQL 5.7 and 8.0 faster than 5.6? That depends a lot on the workload -- both types of SQL and amount of concurrency. Here I summarize results from sysbench on a larger server (48 cores) using 1, 4, 6, 8, 10, 20 and 40 clients to show how things change.
tl;dr
- the workload here is microbenchmarks with a database cached by InnoDB
- 5.7.44 is faster than 8.0.x at all concurrency levels on most microbenchmarks
- for 5.6.51 vs 8.0.x
- for point queries, 5.6.51 is faster at <= 8 clients
- for range queries without aggregation 5.6.51 is always faster
- for range queries with aggregation 5.6.51 is faster except at 40 clients
- for writes, 5.6.51 is almost always faster at 10 or fewer clients (excluding update-index)
Performance summaries
For point queries:
- 5.7.44 is always faster than 8.0
- 8.0.28 suffers from bug 102037 - found by me with sysbench, fixed in 8.0.31
- at what level of concurrency do most things get faster in 5.7 & 8.0 vs 5.6?
- 5.7.44 becomes faster than 5.6.51 at 6+ clients
- 8.0.x becomes faster than 5.6.51 at between 10 and 20 clients
- Two of the microbenchmarks are always faster in 5.6.51 - both do non-covering queries on a secondary index
For range queries without aggregation
- 5.7.44 is always faster than 8.0x
- 5.6.51 is always faster than 5.7.44 and 8.0.x
For range queries with aggregation
- 5.7.44 is almost always faster than 8.0.x
- 5.7.44 becomes faster than 5.6.51 at 6+ clients
- 8.0.x becomes faster than 5.6.51 at 40 clients
For writes
- For update-index
- 5.7.44 and 8.0.x are always faster than 5.6.51 at 4+ clients
- There is an odd drop from ~6X to ~3X for 8.0.32 and 8.0.39 at 20 clients
- 5.7.44 is mostly faster than 8.0.x for 1 to 20 clients and they have similar results at 40 clients
- 5.7.44 & 8.0.x are always faster than 5.6.51 at 20+ clients
Builds, configuration and hardware
I compiled MySQL from source for versions 5.6.51, 5.7.44, 8.0.28, 8.0.32, 8.0.39 and 8.0.41.
The server is an ax162-s from Hetzner with 48 cores (AMD EPYC 9454P), 128G RAM and AMD SMT disabled. It uses Ubuntu 22.04 and storage is ext4 with SW RAID 1 over 2 locally attached NVMe devices. More details on it are here. At list prices a similar server from Google Cloud costs 10X more than from Hetzner.
The configuration files are named my.cnf.cz11a_c32r128 and here for 5.6.51, 5.7.44, 8.0.28, 8.0.32, 8.0.39 and 8.0.41.
Benchmark
I used sysbench and my usage is explained here. To save time I only run 27 of the 42 microbenchmarks and most test only 1 type of SQL statement. Benchmarks are run with the database cached by InnoDB.
The tests run with 8 tables and 10M rows/table. There are 40 client threads, read-heavy microbenchmarks run for 180 seconds and write-heavy run for 300 seconds.
The tests run with 8 tables and 10M rows/table. There are 40 client threads, read-heavy microbenchmarks run for 180 seconds and write-heavy run for 300 seconds.
The command lines to run all tests are:
bash r.sh 8 10000000 180 300 md2 1 1 1bash r.sh 8 10000000 180 300 md2 1 1 4bash r.sh 8 10000000 180 300 md2 1 1 6bash r.sh 8 10000000 180 300 md2 1 1 8bash r.sh 8 10000000 180 300 md2 1 1 10bash r.sh 8 10000000 180 300 md2 1 1 20bash r.sh 8 10000000 180 300 md2 1 1 40
Results
For the results below I split the microbenchmarks into 4 groups: point queries, range queries without aggregation, range queries with queries, writes. The spreadsheet with all data is here. Files with performance summaries for relative and absolute QPS are here. Values from iostat and vmstat per microbenchmark are here for 1 client, 4 clients, 6 clients, 8 clients, 10 clients, 20 clients and 40 clients. These help to explain why something is faster or slower because it shows how much HW is used per query.
The relative QPS is the following where $version is >= 5.7.44.
(QPS for $version) / (QPS for MySQL 5.6.51)
The numbers in the spreadsheets are the relative QPS. When the relative QPS is > 1 then $version is faster than MySQL 5.6.51. When it is 3.0 then $version is 3X faster than the base case.
Results: charts
Notes on the charts
- the y-axis shows the relative QPS
- the y-axis starts at 0.80 to make it easier to see differences
- in some cases the y-axis truncates the good outliers, cases where the relative QPS is greater than 1.5. I do this to improve readability for values near 1.0. Regardless, the improvements are nice.
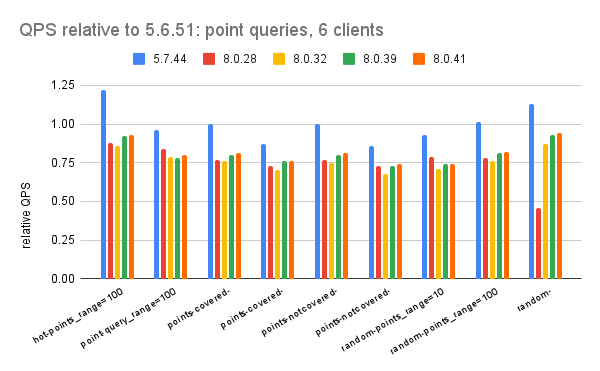
Results: point queries
Summary
- 5.7.44 is always faster than 8.0
- 8.0.28 suffers from bug 102037 - found by me with sysbench, fixed in 8.0.31
- at what level of concurrency do most things get faster in 5.7 & 8.0 vs 5.6?
- 5.7.44 becomes faster than 5.6.51 at 6+ clients
- 8.0.x becomes faster than 5.6.51 at between 10 and 20 clients
- Two of the microbenchmarks are always faster in 5.6.51 - both do non-covering queries on a secondary index


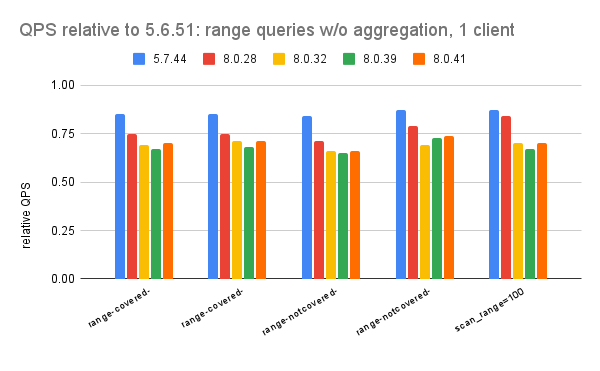
Results: range queries without aggregation
Summary
- 5.7.44 is always faster than 8.0x
- 5.6.51 is always faster than 5.7.44 and 8.0.x


Results: range queries with aggregation
Summary
- 5.7.44 is almost always faster than 8.0.x
- 5.7.44 becomes faster than 5.6.51 at 6+ clients
- 8.0.x becomes faster than 5.6.51 at 40 clients


Results: writes
The relative speedup for the update-index microbenchmark is frequently so large that it obscures the smaller changes on other microbenchmarks. So here I truncate the y-axis for some of the charts (for 6+ clients) and the section that follows has the charts without truncation.
Summary
- For update-index
- 5.7.44 and 8.0.x are always faster than 5.6.51 at 4+ clients
- There is an odd drop from ~6X to ~3X for 8.0.32 and 8.0.39 at 20 clients but you can't see that on the charts in this section because of the truncation. It is visible in the next section. From vmstat I see an increase in CPU/operation (cpu/o) and context switches /operation (cs/o) at 20 clients but not at 40 clients.
- 5.7.44 is mostly faster than 8.0.x for 1 to 20 clients and they have similar results at 40 clients
- 5.7.44 & 8.0.x are always faster than 5.6.51 at 20+ clients


Results: charts for writes without truncation
The y-axis is truncated the the charts for writes in the previous section for 6+ clients. This section has those charts without truncation.


No comments:
Post a Comment