Monday, January 2, 2023

Variance in RocksDB benchmarks on cloud HW

I ran experiments with performance regression tests on AWS servers to measure throughput variance across multiple runs of the benchmarks. I search for a setup with less QPS variance to reduce false positives during performance regression tests. 

The goals were to determine:

  • Which instances have less variance
  • Whether there is less variance with hyperthreading enabled or disabled
  • Whether there is less variance with EBS (io2) or local SSD 

The results were good for most of the instance types that I tried. By good I mean that the max coefficient of variance (stddev/mean) of the QPS for all benchmark steps of a given (server type, number of client threads) pair is less than 3%. Scroll down to the Which to choose section to see the list.

Servers

My focus was on m5d because m5d.2xl.ht1.nvme is the current setup used for automated tests. In the names I use below ht0 means hyperthreading disabled and ht1 means hyperthreading enabled.

The servers that I tested are:

  • m5.2xl.ht0, m5.2xl.ht1
    • m5.2xlarge, 8 vcpu, 32G RAM, EBS (io2, 1T, 32K IOPs), hyperthread disabled/enabled
  • m5d.2xl.ht0.nvme, m5d.2xl.ht1.nvme
    • m5d.2xlarge, 8 vcpu, 32G RAM, local NVMe SSD (300G), hyperthread disabled/enabled
  • m5d.2xl.ht0.io2, m5d.2xl.ht1.io2
    • m5d.2xlarge, 8 vcpu, 32G RAM, EBS (io2, 1T, 32K IOPs), hyperthread disabled/enabled
  • m5d.4xl.ht0.nvme, m5d.4xl.ht1.nvme
    • m5d.4xlarge, 16 vcpu, 64G RAM, local NVMe SSD (300G), hyperthread disabled/enabled
  • m5d.4xl.ht0.io2, m5d.4xl.ht1.io2
    • m5d.4xlarge, 16 vcpu, 64G RAM, EBS(io2, 1T, 64K IOPs), hyperthread disabled/enabled
  • c6i.2xl.ht1
    • c6i.2xlarge, 8 vcpu, 16G RAM, EBS(io2, 1T, 32K IOPs), hyperthread enabled
  • c6i.4xl.ht0, c6i.4xl.ht1
    • c6i.4xlarge, 16 vcpu, 32G RAM, EBS(io2, 1T, 64K IOPs), hyperthread disabled/enabled
  • c6i.8xl.ht0, c6i.8xl.ht1
    • c6i.8xlarge, 32 vcpu, 64G RAM, EBS(io2, 2T, 64K IOPs), hyperthread disabled/enabled
  • c6i.12xl.ht0, c6i.12xl.ht1
    • c6i.12xlarge, 48 vcpu, 96G RAM, EBS(io2, 2T, 64K IOPs), hyperthread disabled/enabled

Benchmark

An overview of how I run RocksDB benchmarks is here. The benchmark was run 3 times per server type and I focus on QPS using standard deviation and coefficient of variance (stddev / mean).

I used a fork of the RocksDB benchmark scripts. My fork is here and then I applied another diff to disable one of the benchmark steps to save time. My helper scripts make it easy for me to run the benchmarks with reasonable configuration options. The important things the helper scripts do are:

  • Configure the shape of the LSM tree so there will be enough levels even with a small database
  • Set max_background_jobs as a function of the number of CPU cores
  • Set the RocksDB block cache size as a function of the amount of RAM

The benchmark was started using x3.sh like this this where $nt is the number of client threads, $cfg is the RocksDB configuration, $num_mem is the number of KV pairs for a cached workload and $num_io is the number of KV pairs for an IO-bound workload:

CI_TESTS_ONLY=true bash x3.sh $nt no 1800 $cfg $num_mem $num_io byrx iobuf

Rather than name the config I describe the values for max_background_jobs (mbj) and the block cache size (bc). The values per server type for nt, mbj, bc, num_mem, num_io were:

  • m5.2xl.ht0, m5.2xl.ht1
    • mbj=4, bc=24g, num_mem=40M, num_io=1B, nt=1,4
  • m5d.2xl.ht0.nvme, m5d.2xl.ht1.nvme
    • mbj=4, bc=24g, num_mem=40M, num_io=750M, nt=1,2,4
  • m5d.2xl.ht0.io2, m5d.2xl.ht1.io2
    • mbj=4, bc=24g, num_mem=40M, num_io=750M, nt=1,2,4
  • m5d.4xl.ht0.nvme, m5d.4xl.ht1.nvme
    • mbj=8, bc=52g, num_mem=40M, num_io=750M, nt=1,4,8
  • m5d.4xl.ht0.io2, m5d.4xl.ht1.io2
    • mbj=8, bc=52g, num_mem=40M, num_io=750M, nt=1,4,8
  • c6i.2xl.ht1
    • mbj=4, bc=12G, num_mem=40M, num_io=1B, nt=4
    • With num_mem=40M the database is slightly larger than memory. I should have used 20M.
  • c6i.4xl.ht0
    • mbj=4, bc=24G, num_mem=40M, num_io=1B, nt=4
  • c6i.4xl.ht1
    • mbj=8, bc=24G, num_mem=40M, num_io=2B, nt=8
  • c6i.8xl.ht0
    • mbj=8, bc=52G, num_mem=40M, num_io=2B, nt=8
  • c6i.8xl.ht1
    • mbj=8, bc=52G, num_mem=40M, num_io=2B, nt=16
  • c6i.12xl.ht0
    • mbj=8, bc=80G, num_mem=40M, num_io=2B, nt=16
  • c6i.12xl.ht1
    • mbj=8, bc=80G, num_mem=40M, num_io=3B, nt=24 

Graphs for a cached workload

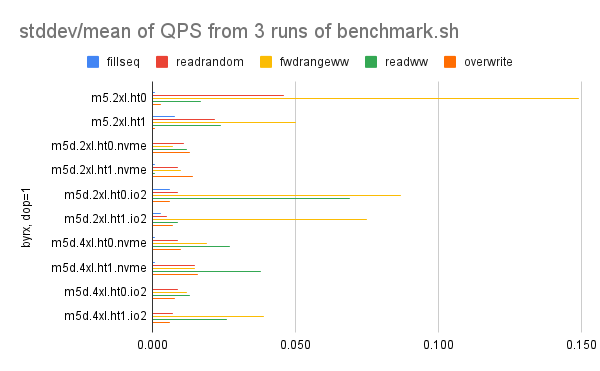
This section has results for a cached workload, described as byrx earlier in this post. The benchmark steps are described here. The graphs show the coefficient of variance (stddev/mean) of the QPS for these benchmark steps: fillseq, readrandom, fwdrangewhilewriting, readwhilewriting and overwrite. Note that to save space the graphs use fwdrangeww and readww in place of fwdrangewhilewriting and readwhilewriting. For reasons I have yet to fully explain the range query tests (fwdrangewhilewriting here) tend to have more QPS variance regardless of hardware.

The graph for 1 client thread is here. The worst variance occurs for m5.2xl.ht0, m5.2xl.ht1, m5d.2xl.ht0.io2 and m5d.2xl.ht1.io2.
The graph for 2 client threads is here. The worst variance occurs for m5d.2xl.ht1.nvme and m5d.2xl.ht0.io2.

The graph for 4 client threads is here. The worst variance occurs for m5d.2xl.ht?.nvme, m5d.2xl.ht0.io2, m5d.4xl.ht0.nvme, m5d.4xl.ht0.io2 and c6i.2xl.ht1. I wrote above that the database didn't fit in the DBMS cache for c6i.2xl.ht1 which might explain why it is an outlier.

The graph for 8 client threads is here. The worst results occur for m5d.4xl.ht?.nvme and m5d.4xl.ht0.io2.

The graph for 16 client threads is here. The worst results occur for c6i.12xlarge.ht0.

Graphs for an IO-bound workload

This section has results for an IO-bound workload, described as iobuf earlier in this post. The benchmark steps are described here. The graphs show the coefficient of variance (stddev/mean) of the QPS for these benchmark steps: fillseq, readrandom, fwdrangewhilewriting, readwhilewriting and overwrite. Note that to save space the graphs use fwdrangeww and readww in place of fwdrangewhilewriting and readwhilewriting.

The graph for 1 client thread is here. The worst results occur for m5d.2xl.ht0.nvme, m5d.2xl.ht0.io2 and m5d.4xl.*.

The graph for 2 client threads is here. The worst results occur for m5d.2xl.ht0.nvme.

The graph for 4 client threads is here. The worst results occur for m5.2xl.ht1, m5d.2xl.*.nvme, m5d.4xl.ht0.io2 and c6i.2xl.ht1.

The graph for 8 client threads is here. The worst results occur for m5d.4xl.ht0.io2 and c6i.4xl.ht1.

The graph for 16 client threads is here. The worst results occur for c6i.8xlarge.ht1.

Which to choose?

Which setup (server type + number of client threads) should be used to minimize variance? The tables below list the maximum and average coefficient of variance from all tests for a given setup where dop=X is the number of client threads. I will wave my hands and claim a good result is a max coefficient of variance that is <= .03 (.03 = 3%).

These setups have good results for both cached (byrx) and IO-bound (iobuf) workloads:

  • m5d.2xl.ht0.nvme - dop=1,2
  • m5d.2xl.ht1.nvme - dop=1
  • m5d.2xl.ht1.io2 - dop=2,4
  • m5d.4xl.ht0.nvme - dop=1,4,8
  • m5d.4xl.ht1.nvme - dop=4,8
  • m5d.4xl.ht0.io2 - dop=1,4,8
  • m5d.4xl.ht1.io2 - dop=4,8
  • c6i.4xl.ht0 - dop=4
  • c6i.4xl.ht1 - dop=8
  • c6i.8xl.ht0 - dop=8
  • c6i.8xl.ht1 - dop=16
  • c6i.12xl.ht0 - dop=16
These are results for byrx (database is cached by RocksDB). 

Max coefficient of variance
dop=1dop=2dop=4dop=8dop=16
m5.2xl.ht00.1490.010
m5.2xl.ht10.0500.028
m5d.2xl.ht0.nvme0.0130.0210.031
m5d.2xl.ht1.nvme0.0140.0660.043
m5d.2xl.ht0.io20.0870.0480.039
m5d.2xl.ht1.io20.0750.0160.014
m5d.4xl.ht0.nvme0.0270.0280.026
m5d.4xl.ht1.nvme0.0380.0170.019
m5d.4xl.ht0.io20.0130.0280.018
m5d.4xl.ht1.io20.0390.0090.015
c6i.2xl.ht10.115
c6i.4xl.ht00.021
c6i.4xl.ht10.008
c6i.8xl.ht00.013
c6i.8xl.ht10.007
c6i.12xl.ht00.007

These are results for iobuf (database is larger than memory).

Max coefficient of variance
dop=1dop=2dop=4dop=8dop=16
m5.2xl.ht00.0050.006
m5.2xl.ht10.0070.014
m5d.2xl.ht0.nvme0.0250.0270.016
m5d.2xl.ht1.nvme0.0050.0110.030
m5d.2xl.ht0.io20.0080.0080.010
m5d.2xl.ht1.io20.0050.0080.004
m5d.4xl.ht0.nvme0.0110.0100.007
m5d.4xl.ht1.nvme0.0100.0080.004
m5d.4xl.ht0.io20.0110.0280.013
m5d.4xl.ht1.io20.0110.0110.004
c6i.2xl.ht10.042
c6i.4xl.ht00.007
c6i.4xl.ht10.012
c6i.8xl.ht00.010
c6i.8xl.ht10.017
c6i.12xl.ht00.007

Performance summaries

In the linked URLs below: byrx means cached by RocksDB and iobuf means IO-bound with buffered IO. The links are to the performance summaries generated by the benchmark scripts.

Results for dop=1

Results for dop=2
Results for dop=4
Results for dop=8
Results for dop=16
Results for dop=24

Friday, December 2, 2022

Benchmark(et)ing RocksDB vs SplinterDB

While I am a huge fan of research papers presenting storage engines that claim to be better than RocksDB, I am always wary of the performance results. A paper can be great despite an imperfect performance evaluation, so pointing out the imperfections doesn't take away from the interesting ideas in the paper. Also, as a believer of the (C)RUM Conjecture I want to know how the new thing is better and worse, but papers mostly focus only on the better parts and don't highlight what isn't better.

One factor that determines the truthiness of a database benchmark is the number of DBMS that are compared. It is hard enough to get expertise in one DBMS and more DBMS == more chance of making a mistake. Here I present a result for RocksDB and SplinterDB. I am definitely not an expert on SplinterDB. Perhaps my results are more truthy than true.

I read the SplinterDB paper and hope their research continues. However, the paper didn't have enough detail on how the benchmark was done so I had to guess. I wish more papers published artifacts (scripts, etc) that made reproduction easier. I expect reproduction to be infrequent and don't want researchers to spend their time doing that, but the artifacts are nice to have.

tl;dr

  • For insert performance
    • It is risky to compare write performance between SplinterDB and RocksDB because SplinterDB doesn't force data to storage via fsync, fdatasync or msync, and that is documented.
    • For IO-bound - RocksDB with universal was the fastest
    • For cached - performance is similar between RocksDB and SplinterDB
  • For point query performance
    • For IO-bound - RocksDB was faster because it does less IO/query
    • For cached - SplinterDB was faster because it uses less CPU/query
  • For range query performance
    • For IO-bound - RocksDB was a lot faster because it does less IO/query
    • For cached - RocksDB was a lot faster because it uses less CPU/query

SplinterDB

I patched SplinterDB as of git hash a1833060. My patched SplinterDB branch is here. The patch includes:

  • debug printfs I added to understand the code
  • changes to stop the lookup tests after 1200 seconds
  • a fix for a memory leak that I reported, and has now been fixed upstream (issue 440)
  • hardwired to only run the Small range test for range queries
  • make the payload size a constant rather than a range to match what I do for RocksDB
Details

I used my small servers (4-core NUC, 16G RAM, NVMe SSD), patched SplinterDB and RocksDB 7.6.0. The benchmarks were run with 1 thread for inserts and then 1 thread for queries. My test scripts are here.

The benchmark was run for two workloads: cached and IO-bound. Cached means cached by the DBMS and IO-bound means the database is larger than memory. The workload is simple: insert in random order, do point queries, do range queries where a range query fetches 10 values. I used the benchmark client provided by each DBMS: db_bench for RocksDB and driver_test splinter_test for SplinterDB. The scripts that have the config details are here for RocksDB and SplinterDB.

For RocksDB I repeated tests with leveled and universal compaction.

Tests were done for the following sizes:
  • cached: 50M rows, 100-byte value
  • cached: 25M rows, 200-byte value
  • IO-bound: 2B rows, 100-byte value
  • IO-bound: 1B rows, 200-byte value
To get results for RocksDB with universal I had to repeat the IO-bound tests at 75% of the number of rows listed above (1.5B for 100-byte, 750M for 200-byte) because issue 10533 caused me to get unexpected disk full errors.

For RocksDB I did fillrandom to measure insert performance, then reloaded with fillseq to make sure all keys from 1..N would exist. Next time I might use filluniquerandom (see here). For RocksDB I measured performance immediately after the load (well, after waiting for compaction debt to reduce), then again after flushing the memtable and L0. And for leveled compaction I then flushed the L1 and measured perf again. Here I report performance after flushing the memtable and L0 (see here).

The point and range query benchmark steps ran for 1200 seconds each with SplinterDB and 1800 seconds each with RocksDB. Were I to repeat this I would use the same duration.

Differences

Things that differ between RocksDB and SplinterDB:
  • A uniform key access distribution was used by both benchmark clients. However, RocksDB does this by using a RNG while SplinterDB uses something like: hash(x) for x in 1 ... N.  I didn't confirm it, but I am curious if the point and range query tests will see the same key sequence, and if tests are run for a short period of time then point query tests warm the cache for the range query tests making results less truthy for IO-bound workloads.
  • SplinterDB does not have redo/WAL so I disabled that for RocksDB. 
  • SplinterDB does not sync (fsync, msync, fdatasync) writes and I did not try to mimic that with RocksDB. This means that write amplification will be under-stated and write throughput will be over-stated for SplinterDB when compared to RocksDB.
Results for cached

Legend:
* insert - inserts/second
* point - point queries/second
* range - range queries/second
* wamp - write-amplification during the inserts

50M rows, 100-byte values
---- ops/second ----
insert  point   range   wamp    dbms
533584  246964  31236   1.3     splinterdb
483519  191592  76600   4.5     rocksdb, leveled
488971  180769  57394   2.9     rocksdb, universal

25M rows, 200-byte values
---- ops/second ----
insert  point   range   wamp    dbms
474446  261444  33538   1.1     splinterdb
495325  188851  75122   3.7     rocksdb, leveled
500862  201667  83686   2.8     rocksdb, universal

Results for IO-bound

The performance can be explained by the amount of read IO per query.

IO reads per point query for 2B rows, 100-byte values:
  • 1.29 - SplinterDB
  • 0.98 - RocksDB, leveled
  • 1.00 - RocksDB, universal, 1.5B rows
IO reads per range query for 2B rows, 100-byte values:
  • 7.42 - SplinterDB
  • 2.34 - RocksDB, leveled
  • 3.24 - RocksDB, universal, 1.5B rows
2B rows, 100-byte values
---- ops/second ----
insert  point   range   wamp    dbms
308740  6110    1060     3.7    2B rows, splinterdb
181556  8428    3056    14.1    2B rows, rocksdb, leveled
205736  8404    3029    12.7    1.5B rows, rocksdb, leveled
393873  8144    1889     6.0    1.5B rows, rocksdb, universal

1B rows, 200-byte values
---- ops/second ----
insert  point   range   wamp    dbms
221007  7175     908     3.7    1B rows, splinterdb
107692  8393    2436    13.0    1B rows, rocksdb, leveled
121519  8159    2519    11.7    750M rows, rocksdb, leveled
324555  8621    2763     5.3    750M rows, rocksdb universal

Details

For SplinterDB with 2b rows and 100-byte values the tree shape was:

Space used by level: trunk_tree_height=4
0:   191168 MiB
1:    34554 MiB
2:     6586 MiB
3:     1307 MiB
4:      206 MiB

And the LSM tree shape for RocksDB with 2B rows, 100-byte values and leveled compaction uses long lines so that is in a gist.


Wednesday, November 30, 2022

Compiling MySQL 5.6 & 5.7 on Ubuntu 22.04

One of my hobbies is testing open source DBMS for CPU regressions and for that I want to compare perf between old and new versions of the DBMS. Depending on the DBMS it can be a challenge to build the old DBMS with the current (modern) compiler toolchain. 

Using open source frequently means compiling from source and compiling from source eventually means debugging a failed build. Alas, the proliferation of build tools means you are likely to be debugging a build tool you know little about. For me that included svn+MongoDB, cmake+MySQL, make/configure+MySQL, mvn+Linkbench, mvn+First_Robotics and make+RocksDB. Perhaps my debugging would be easier if there weren't as many build tools.

Postgres might be an exception WRT compiling old versions - it works great. Alas, this isn't as easy with MySQL versions 5.6.51 and 5.7.39. Note that MySQL 5.6 reached end of life in 2021 but 5.7 doesn't reach that until next year. For MySQL 5.6, 5.7 and perhaps some 8.0 releases prior to 8.0.31, there is a common error -- cmake fails with a message about being unable to find ssl and a suggestion to install it. 
CMake Error at cmake/ssl.cmake:63 (MESSAGE):
  Please install the appropriate openssl developer package.

Call Stack (most recent call first):
  cmake/ssl.cmake:306 (FATAL_SSL_NOT_FOUND_ERROR)
  CMakeLists.txt:603 (MYSQL_CHECK_SSL)
This occurs on Ubuntu 22.04.1 with gcc 11.3.0 and OpenSSL was definitely installed, and used when I compiled MySQL 8.0.31 from source. The problem is there are several conditions that trigger the error message and one of them occurs when the version number is wrong or the version number cannot be parsed from a header. So a better error message would make debugging easier in the future.

For 5.7.39 I fixed the error by backporting code from 8.0.31 that parses the SSL version numbers from openssl/openslv.h. A diff for that is here. Perhaps the real fix needed is smaller but I was in copy/paste mode given my lack of cmake skills.

For 5.6.51 I fixed the error in the same way and then added --std=c++11 to the CXX flags because some code uses the register keyword which is no longer a thing in C++ 2017. A diff for that is here. Output from the compiler error before --std=c++11 was added is here.

For MySQL 8.0.28 a diff to help the build find SSL is here. Unfortunately, it looks like MySQL 8.0.28 cannot compile with OpenSSL 3.X and expects something older. Errors are here. Looks like MySQL 8 was made aware of OpenSSL 3 in 8.0.30 (see here).

Updates:
  • Filed bug 109251, must stay ahead of Vilnius DB in the bug reporter contest
  • Compiling FB MySQL 5.6.35 was even more fun, see below
Compiling FB MySQL 5.6.35

A diff to make this work is here. I had to modify cmake/ssl.cmake as explained above and storage/rocksdb/get_rocksdb_files.sh.  The cmake command line is here.

I also did cd rocksdb; make static_lib to generate rocksdb/util/build_version.cc because the automation to do that was not working, but after I applied the diff listed above that wasn't needed.

Compiling FB MySQL 8.0.28

I needed a small diff to edit storage/rocksdb/get_rocksdb_files.sh and fix a few other bugs similar to what was done for FB MySQL 5.6.35 above. The cmake command line is here.

While boost is installed by git submodule update I am not sure that works for my OSS builds and/or cmake command line (-DWITH_BOOST=$PWD/../boost). So I just do:
  cd $SRC_ROOT; mv boost boost.up; cp -p -r ~/mysql-8.0.28/boost . 

Tuesday, November 29, 2022

Insert benchmark: Postgres, InnoDB and MyRocks with low concurrency

This has results for the insert benchmark using Postgres, InnoDB and MyRocks. For an overview of the insert benchmark see here and here. Some information on the performance summaries generated by my test scripts is here. I used small servers and ran the test at low concurrency (1 or 2 threads) for cached and IO-bound workloads. The insert benchmark has several phases and the interesting phases are: insert-only without secondary indexes, insert-only with 3 secondary indexes and then range queries with rate-limited inserts.

Performance reports are provided for:

Disclaimer - I used a small server and will soon repeat this on larger servers and with more concurrency.

tl;dr

  • Postgres is boring: no CPU regressions from version 12 to 15 for cached and IO-bound workloads.
    • The insert benchmark found a CPU regression in 15beta1 which was quickly fixed.
  • InnoDB with a cached workload has large CPU regressions from 5.6 to 8.0.
    • This is visible here. By large I mean that the insert and query rates for InnoDB in 8.0.31 are ~64% and ~75% of the rates in 5.6. The root cause is new CPU overhead in code other than the storage engine.
  • MyRocks with a cached workload has large CPU regressions from 5.6 to 8.0
    • This is visible here. The regression for insert-only without secondary indexes is similar to InnoDB. The regression for range queries is smaller than the one above for InnoDB (throughput declines by ~8%). The root cause is new CPU overhead in upstream MySQL.
  • InnoDB with an IO-bound workload has large CPU regressions in the insert-only without secondary index phase, which is normally CPU-bound. See here.
    • The regression is similar to what I describe above for the cached workload. Throughput for the insert-only with secondary index phase and range queries with rate-limited inserts phase is better in 8.0.31 than 5.6.
  • MyRocks with an IO-bound workload has CPU regressions that are similar to MyRocks with a cached workload. See here.

Friday, November 18, 2022

SSD read response time: raw device vs a filesystem

I am trying to understand why 4kb random reads from an SSD are about 2X slower when using a filesystem vs a raw device and this reproduces across different servers but I am only sharing the results from my home Intel NUCs. The symptoms are, the read response time is:

  • ~2X larger per iostat's r_await for reads done via a filesystem vs a raw device (.04 vs .08 millisecs)
  • ~3X larger per blkparse for reads done via a filesystem vs a raw device (~16 vs 50+ microsecs)
Once again, I am confused. Is something below user land doing (if from-filesystem -> go-slow). In theory, if the D->C transition reported by blkparse includes a lot of CPU overhead from the filesystem then that might explain this, but the CPU per IO overhead isn't large enough for that to be true here.

My test scripts for this are rfio.sh and do_fio.sh.

Update - the mystery has been solved thanks to advice from an expert (Andreas Freund) who is in my Twitter circle, and engaging with experts I would never get to meet in real life is why I use Twitter. I have been running the raw device tests with the device mostly empty and the fix is to run the test with it mostly full otherwise the SSD firmware can do something special (and faster) when reading data that was never written.

blktrace + blkparse

I used fio for 3 configurations: raw device, O_DIRECT and buffered IO. For O_DIRECT and buffered IO the filesystem is XFS and there were 8 20G files on a server that has 16G of RAM. The results for O_DIRECT and buffered IO were similar.

The results I discuss in the next 2 paragraphs are from fio run with --numjobs=1.

Output from blkparse for a few IOs are here. The lifecycle of an IO starts with state Q (queued) and ends with state C (completed). The number in parentheses at the end of the line for state C is the response time in microseconds. The RWBS field has RA for buffered IO (R = read, A = possible readahead) and R for O_DIRECT and raw. The timestamp format is seconds.nanoseconds and I pasted examples from ~18 seconds into the measurement. Most of the time for an IO request occurs between state D (dispatch to device) and C (completed). The blkparse man page is here.

From the examples I shared the response time is ~15 microseconds for raw and 50+ microseconds for O_DIRECT and buffered IO. Averaging the values from all samples collected over 20 seconds shows the average was 15 microseconds for raw vs ~73 microseconds for O_DIRECT and buffered. The read request size is 4096 in all cases (see + 8 in the blkparse output).

The sector offsets in the blkparse output are all a multiple of 8 (8 x 512 == 4096) so the requests have that in common between raw, O_DIRECT and buffered.

fio

Command lines and performance metrics from fio are here. I ran fio for numjobs in 1, 2, 4, 8, 16, 32, 48 and 64. A summary of the results:
And results after making the fix described in Update above, the results from raw are only slightly better than O_DIRECT, while buffered gets a better throughput number because it benefits from some hits in the OS page cache.

Monday, October 31, 2022

s/optimal/better/g - on reviewing conference papers

I spent a few years reviewing papers for database conferences. I think that is winding down. I was OK as a reviewer, definitely not great, and this summarizes my experience.

For starters, I am in awe of good reviwers. As a reviewer you get to see feedback from the other reviwers after submitting your review. And I was always nervous while waiting to see the other reviews. Was my review an outlier? How much did I miss in my review? Reading good reviews after submitting a mediocre review is a great way to learn.

As always, a key to success is to choose the right base case especially if you want to show linear speedup or scaleup. Many of the papers use the DBMS that I know quite well (MySQL, RocksDB) as the base case. So I have frequent someone on the internet is wrong moments while reading such papers. My offer to provide (free) benchmark advice to research projects was ignored. But maybe that is OK, because I am already busy.

My goal was to focus on the ideas in the paper and allow that the experimental results might be truthy rather than true. There are many interesting ideas in conference papers even if the experimental results aren't perfect. The review process was better for me after I learned to appreciate the ideas and worry less about flaws in the benchmarks.

I prefer to read a paper that explains where the new idea both is and is not better, but perhaps the marketing pressure and page limit means that papers don't focus much on where the new idea isn't better. I also prefer to have an explanation of the results -- I have had to retract a few DBMS perf blog posts because I didn't explain the results and they turned out to be misleading or bogus. Alas, papers rarely explained the (disappointing) results of the base case when showing they were so much faster than the base case.

Frequent feedback I had for papers:

  • s/optimal/better/g because optimal has a high bar. Papers would show their thing improved performance in some cases but better might not be optimal. Some math would be needed for that.
  • Provide more details to make reproduction possible. I am not offering to spend the time to do a repro nor am I suggesting that others should spend their time on that. But I want to know basic things about the base case (the thing that your thing is better than) including version tested, configuration details and command lines.
A short rant on the innovation bar
  • By innovation bar I mean the requirement that a paper shows how the idea is new relative to previously published peer-reviewed research. For some research track papers that I have reviewed I feel like the bar is raised too high, but that isn't my rant. My rant is that I have seen at least one industrial track paper rejected for not being innovative and my reading of the guidelines for industrial track papers in VLDB and SIGMOD is that there isn't an innovation bar for industry papers.
Bogus feedback that I avoided giving:
  • This idea has been implemented by DBMS or documented in some blog post. Conferences place a lot of value on innovation but fortunately the scope for prior art is limited to peer reviewed publications, not random blogs like this one. And researchers should not be expected to know all of the implementation details for amazing but not always well documented open and closed source DBMS. By bogus I mean that this doesn't count against the innovation bar -- research-track papers must show that something is innovative in their work. When said idea has previously been published then the reviewed paper must show how it differs.  But the paper isn't required to show how it differs from an idea described in a blog post or implemented in a production DBMS. Sometimes I gave feedback with a strong disclaimer when ideas have previously appeared in blog posts or an existing DBMS. And by strong disclaimer I mean that I made it clear that I would not and could not hold this against the paper.
Feedback that I was extremely reluctant to provide:
  1. Run X more tests. I am happy to require that before software is deployed in production. I am wary of asking for much more unless the experiment section is sad.
Updates:
  • Clarified what I mean by bogus feedback
  • Added rant on innovation bar

CPU-bound sysbench on a large server: Postgres 12 to 19 beta1

This has results from sysbench on a small server with Postgres versions 12 through 19 beta1. Sysbench is run with high concurrency (40 conne...