This is part 4 of my series on using HW counters from Linux perf to explain why MySQL gets slower from 5.6 to 8.0. Refer to part 1 for an overview.
What happened in MySQL 5.7 and 8.0 to put so much more stress on the memory system?
tl;dr
- It looks like someone sprinkled magic go slower dust across most of the MySQL code because the slowdown from MySQL 5.6 to 8.0 is not isolated to a few call stacks.
- MySQL 8.0 uses ~1.5X more instructions/operation than 5.6. Cache activity (references, loads, misses are frequently up 1.5X or more. TLB activity (loads, misses) is frequently up 2X to 5X with the iTLB being a bigger problem than the dTLB.
- innodb_log_writer_threads=ON is worse than I thought. I will soon have a post on that.
- I don't have much experience using Linux perf counters to explain performance changes.
- There are huge increases for data TLB, instruction TLB and L1 cache counters. From the Xeon CPU (socket2 below) the change from MySQL 5.6.21 to 8.0.34 measured as events/query are:
- branches, branch misses: up ~1.5X, ~1.2X
- cache references: up ~2.8X
- instructions: up ~1.5X
- dTLB loads, load-misses, stores: up ~1.6X, ~1.9X, ~1.8X
- iTLB loads, load-misses: up ~2.1X, ~2.4X
- L1 data cache loads, load-misses, stores: up ~1.6X, ~1.5X, ~1.8X
- L1 instruction cache load-misses: up ~1.9X
- LLC loads, stores: up ~1.6X, ~1.9X
- Context switches and CPU migrations are down
- For many of the HW counters the biggest jumps occur between the last point release in 5.6 and the first in 5.7 and then again between the last in 5.7 and the first in 8.0. Perhaps this is good news because it means the problems are not spread across every point release.
The posts in this series are:
Performance
The charts below show average throughput (QPS, or really operations/s) for the l.i0 benchmark step.
- The benchmark uses 1 client for the small servers (beelink, ser7) and 12 clients for the big server (socket2).
- MySQL 8.0 is much slower than 5.6 on the small servers (beelink, ser7) and slightly slower on the big server (socket2).


Refer to the Results section in part 1 to understand what is displayed on the charts. The y-axis frequently does not start at zero to improve readability. But this also makes it harder to compare adjacent graphs.
Below when I write up 30% that is the same as up 1.3X. I switch from the former to the latter when the increase is larger than 99%.
Spreadsheets are here for beelink, ser7 and socket2. See the Servers section above to understand the HW for beelink, ser7 and socket2.
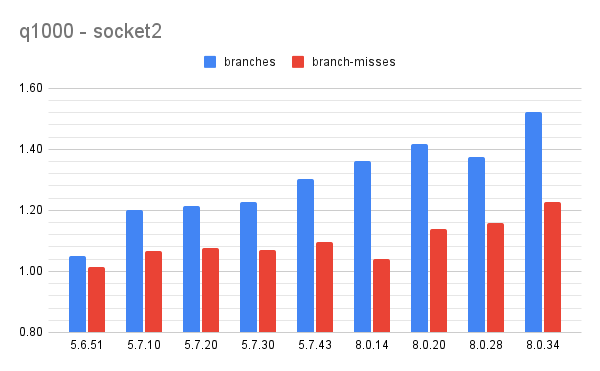
Results: branches and branch misses
Summary:
- the Results section above explains the y-axis
- on beelink
- from 5.6.51 to 5.7.10 branches up 24%, branch-misses up 49%
- from 5.7.43 to 8.0.34 branches up 32%, branch-misses up 71%
- on ser7
- from 5.6.51 to 5.7.10 branches up 27%, branch-misses up 36%
- from 5.7.43 to 8.0.34 branches up 20%, branch-misses up 53%
- on socket2
- from 5.6.51 to 5.7.10 branches up 14%, branch-misses up 6%
- from 5.7.43 to 8.0.34 branches up 17%, branch-misses up 12%


Summary:
- the Results section above explains the y-axis
- on beelink
- from 5.6.51 to 5.7.10 references up 35%, misses up 30%
- from 5.7.43 to 8.0.34 references up 42%, misses up 41%
- on ser7
- from 5.6.51 to 5.7.10 references up 43%, misses up 2.3X
- from 5.7.43 to 8.0.34 references up 44%, misses up 94%
- on socket2
- from 5.6.51 to 5.7.10 references up 44%, misses down 2%
- from 5.7.43 to 8.0.34 references up 63%, misses down 2%
.png)
.png)
.png)
Summary:
- the Results section above explains the y-axis
- on beelink
- from 5.6.51 to 5.7.10 cycles up 35%, instructions up 31%, cpi up 2%
- from 5.7.43 to 8.0.34 cycles up 48%, instructions up 36%, cpi up 9%
- on ser7
- from 5.6.51 to 5.7.10 cycles up 51%, instructions up 38%, cpi up 10%
- from 5.7.43 to 8.0.34 cycles up 52%, instructions up 28%, cpi up 17%
- on socket2
- from 5.6.51 to 5.7.10 cycles up 8%, instructions up 15%, cpi down 6%
- from 5.7.43 to 8.0.34 cycles up 9%, instructions up 19%, cpi down 9%
.png)
.png)
.png)
Summary:
- the Results section above explains the y-axis
- on beelink
- from 5.6.51 to 5.7.10 dTLB-loads up 62%, dTLB-load-misses up 44%
- from 5.7.43 to 8.0.34 dTLB-loads up 55%, dTLB-load-misses up 52%
- on ser7
- from 5.6.51 to 5.7.10 dTLB-loads up 66%, dTLB-load-misses up 23%
- from 5.7.43 to 8.0.34 dTLB-loads up 53%, dTLB-load-misses up 28%
- on socket2
- loads
- from 5.6.51 to 5.7.10 dTLB-loads up 17%, dTLB-load-misses up 9%
- from 5.7.43 to 8.0.34 dTLB-loads up 23%, dTLB-load-misses up 50%
- stores
- from 5.6.51 to 5.7.10 dTLB-stores up 22%, dTLB-store-misses down 33%
- from 5.7.43 to 8.0.34 dTLB-stores up 30%, dTLB-store-misses up 91%
.png)
.png)
.png)
Summary:
- the Results section above explains the y-axis
- on beelink
- from 5.6.51 to 5.7.10 iTLB-loads up 65%, iTLB-load-misses up 3.1X
- from 5.7.43 to 8.0.34 iTLB-loads up 54%, iTLB-load-misses up 2.7X
- on ser7
- from 5.6.51 to 5.7.10 iTLB-loads up 72%, iTLB-load-misses up 1.9X
- from 5.7.43 to 8.0.34 iTLB-loads up 21%, iTLB-load-misses up 2.5X
- on socket2
- from 5.6.51 to 5.7.10 iTLB-loads up 28%, iTLB-load-misses up 25%
- from 5.7.43 to 8.0.34 iTLB-loads up 27%, iTLB-load-misses up 2.1X
.png)
.png)
.png)
- the Results section above explains the y-axis
- on beelink
- dcache
- from 5.6.51 to 5.7.10 loads up 39%, load-misses up 32%
- from 5.7.43 to 8.0.34 loads up 45%, load-misses up 43%
- icache
- from 5.6.51 to 5.7.10 loads-misses up 25%
- from 5.7.43 to 8.0.34 loads-misses up 49%
- on ser7
- dcache
- from 5.6.51 to 5.7.10 loads up 29%, load-misses up 19%
- from 5.7.43 to 8.0.34 loads up 6%, load-misses up 5%
- icache
- from 5.6.51 to 5.7.10 loads-misses up 29%
- from 5.7.43 to 8.0.34 loads-misses up 17%
- on socket2
- dcache
- from 5.6.51 to 5.7.10 loads up 18%, load-misses up 11%, stores up 23%
- from 5.7.43 to 8.0.34 loads up 22%, load-misses up 19%, stores up 29%
- icache
- from 5.6.51 to 5.7.10 loads-misses up 25%
- from 5.7.43 to 8.0.34 loads-misses up 37%
.png)
.png)
.png)
The LLC counters were only supported in the socket2 CPU.
Summary:
- the Results section above explains the y-axis
- on socket2
- loads
- from 5.6.51 to 5.7.10 loads up 5%, load-misses down 13%
- from 5.7.43 to 8.0.34 loads up 27%, load-misses down 4%
- stores
- from 5.6.51 to 5.7.10 stores are flat, store-misses down 28%
- from 5.7.43 to 8.0.34 stores up 56%, store-misses up 22%
.png)
- on beelink
- from 5.6.21 to 5.7.10 context switches down 5%
- from 5.7.43 to 8.0.34 context switches up 30%
- on ser7
- from 5.6.21 to 5.7.10 context switches up 12%
- from 5.7.43 to 8.0.34 context switches up 8%
- on socket2
- from 5.6.21 to 5.7.10 context switches down 18%
- from 5.7.43 to 8.0.34 context switches up 21%
.png)
.png)
.png)
- on beelink
- from 5.6.21 to 5.7.10 CPU migrations up 24%
- from 5.7.43 to 8.0.34 CPU migrations up 6.1X
- on ser7
- from 5.6.21 to 5.7.10 CPU migrations up 4.5X
- from 5.7.43 to 8.0.34 CPU migrations up 2.4X
- on socket2
- from 5.6.21 to 5.7.10 CPU migrations down 44%
- from 5.7.43 to 8.0.34 CPU migrations up 46%
.png)
.png)
.png)


.png)
.png)
.png)
.png)
.png)
.png)
.png)
.png)
.png)
.png)
.png)
.png)
.png)
.png)
.png)
.png)
.png)
.png)
.png)
.png)
.png)
.png)