Tuesday, October 31, 2023

Postgres vs MySQL: the impact of CPU overhead on performance

This post documents how MySQL and Postgres performance has changed over time using sysbench. It compares QPS for Postgres 11.21 vs MySQL 5.6.21 and then Postgres 16.0 vs MySQL 8.0.34.

The focus here is on CPU overhead and for that a workload that is low-concurrency, CPU-bound and cached is sufficient. However a full comparison would also include results for workloads with more concurrency and workloads that are IO-bound.

The benchmark was explained in a series of posts - see part 1part 2part 3part 4 and part 5 and the results here are from my small server. Usually I avoid direct comparisons between Postgres and MySQL but I am doing this because I care about the future of MySQL and the CPU regressions in it over time have become a problem.

tl;dr

  • Postgres 11.21 and MySQL 5.6.21 have similar QPS on most sysbench tests
  • Postgres 16.0 gets much more QPS than MySQL 8.0.34 on most sysbench tests
  • The problem for MySQL is new CPU overhead

Results

The spreadsheet with all of the numbers is here.

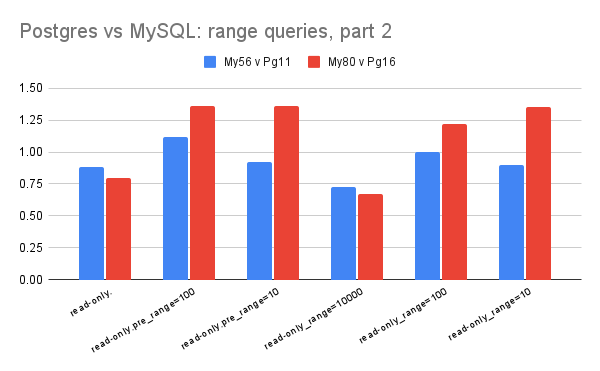
The charts below have two bars per sysbench test. Both bars show relative QPS.
  • The first (blue) bar has (QPS for Postgres 11.21 / QPS for MySQL 5.6.21)
  • The second (red) bar has (QPS for Postgres 16.0 / QPS for MySQL 8.0.34)
Note that the red bars tend to be taller than the blue bars because per-query CPU overheads have gotten larger from MySQL 5.6 to 8.0 while they have not from Postgres 11 to 16.

Perf regressions in MySQL from 5.6.21 to 8.0.35 using sysbench and a medium server, part 5

This is part 5 of my results from sysbench vs MySQL on a medium server - see part 1part 2part 3 and part 4. This post documents how performance changes from MySQL 8.0.27 to 8.0.32.

QPS decreased by ~10% for many of the sysbench tests from MySQL 8.0.27 to 8.0.31. The problem is new CPU overheads from code changes that I am still documenting. While perf regressions over time in MySQL are to be expected, regressions of this size are not and hopefully can be fixed.

Some of this is thanks to changes in the InnoDB record layer. Hopefully this gets fixed, if not use MyRocks. Percona has bug PS-8822 open for this. I have a blog post from the Insert Benchmark for this.

tl;dr:

  • Bug 102037 was fixed in MySQL 8.0.31 which improves QPS for many point query tests
  • Other changes, including changes to the InnoDB record layer, increase CPU overhead and reduce performance for many of the tests not helped by the fix for bug 102037.
    • For point queries MySQL 8.0.32 gets ~8% less QPS than 8.0.27 in the cases not helped by the bug 102037 fix 
    • For range queries MySQL 8.0.32 gets ~9% less QPS than 8.0.27
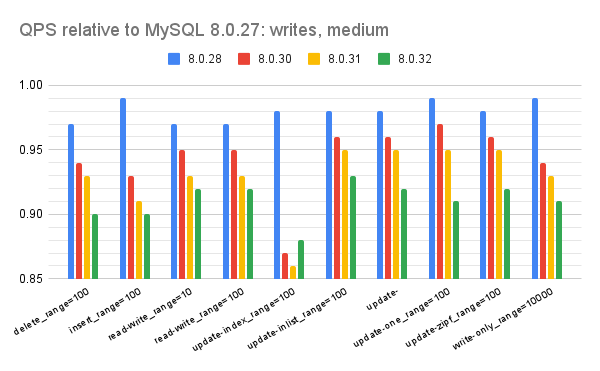
    • For writes MySQL 8.0.32 gets ~10% less QPS than 8.0.27

Results

The spreadsheet with all of the numbers is here.

For all charts below:
  • The y-axis doesn't start at 0 to improve readability.
  • Each section has two charts - the first for tests using the medium server, the second for tests using the small server.
  • The charts show relative throughput which is (QPS for $me / QPS for MySQL 8.0.27). When that value is less than one then the version is slower than MySQL 8.0.27.
Point queries, part 1

Summary
  • Fixing bug 102037 helps many of the point query tests
  • Tests not helped by the fix for bug 102037 get ~8% less QPS in 8.0.32 vs 8.0.27
Point queries, part 2

Summary
  • Summary
    • Fixing bug 102037 helps many of the point query tests
    • Tests not helped by the fix for bug 102037 get ~8% less QPS in 8.0.32 vs 8.0.27
Range queries, part 1

Summary
  • MySQL 8.0.32 gets ~10% less QPS than 8.0.27
Range queries, part 2

Summary
  • MySQL 8.0.32 gets ~9% less QPS than 8.0.27
Writes

Summary
  • MySQL 8.0.32 gets ~10% less QPS than 8.0.27

Perf regressions in MySQL from 5.6.21 to 8.0.35 using sysbench and a medium server, part 4

This is part 4 of my results from sysbench vs MySQL on a medium server - see part 1part 2 and part 3. This post has results for all MySQL 8.0 releases.

There are significant drops in QPS from 8.0.27 to 8.0.28 and then again from 8.0.28 to 8.0.30. Some of this is thanks to changes in the InnoDB record layer. Hopefully this gets fixed, if not use MyRocks. Percona has bug PS-8822 open for this. I have a blog post from the Insert Benchmark for this.

tl;dr: QPS for MySQL 8.0.35 relative to early 8.0

  • For point queries is ~10% less
  • For range queries is 10% to 15% less, except for long range scans where it is ~20% less
  • For writes is 0% to 20% less

Results

The spreadsheet with all of the numbers is here.

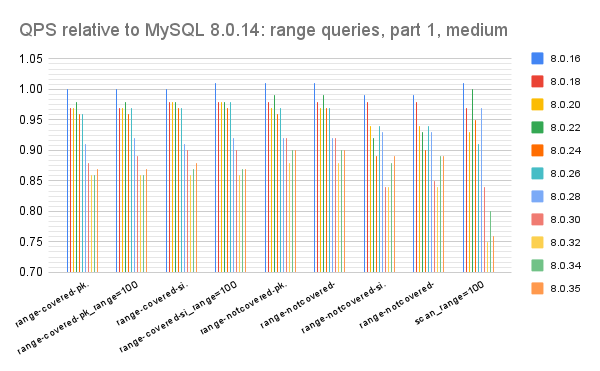
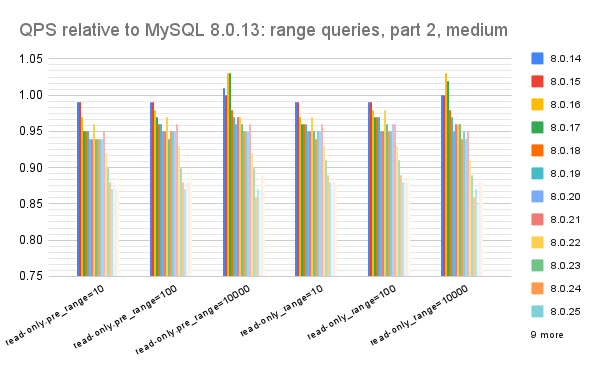
For all charts below:
  • The y-axis doesn't start at 0 to improve readability.
  • Each section has three charts. The first two charts have many data points and aren't as easy to read as the third and fourth charts:
    • the first is from all 8.0 releases on the medium server
    • the second is from all 8.0 releases on the small server
    • the third is from the even-numbered releases on the medium server
  • The charts show relative throughput which is (QPS for $me / QPS for early MySQL 8.0). When that value is less than one then the version is slower than early MySQL 8.0. The early MySQL 8.0 release is either 8.0.13 or 8.0.14.
Point queries, part 1

Summary
  • QPS for MySQL 8.0.35 is ~10% less than 8.0.13
  • QPS has improved from MySQL 8.0.2x to 8.0.3x
Point queries, part 2

Summary
  • QPS for MySQL 8.0.35 is ~10% less than 8.0.13
  • QPS for SELECTs with a large inlist was bad from 8.0.22 to 8.0.30. This was bug 102037, which was found by sysbench and reported by me.
Range queries, part 1

Summary
  • QPS for MySQL 8.0.35 is between 10% and 15% less than 8.0.13
  • QPS for full scans is ~20% less in MySQL 8.0.35 than 8.0.13
  • QPS drops by ~5% from 8.0.27 to 8.0.28 thanks to changes in the InnoDB record layer
Range queries, part 2

Summary
Writes

Summary

Perf regressions in MySQL from 5.6.21 to 8.0.35 using sysbench and a medium server, part 3

This is part 3 of my results from sysbench vs MySQL on a medium server - see part 1 and part 2. This post has results for all MySQL 5.7 releases.

tl;dr: QPS for MySQL 5.7.43 relative to 5.7.10

  • For point queries is similar
  • For range queries is ~8% slower except for full table scans where it is ~21% slower 
  • For writes is up to 20% better

Results

The spreadsheet with all of the numbers is here.

For all charts below:
  • The y-axis doesn't start at 0 to improve readability.
  • Each section has four charts. The first two charts have many data points and aren't as easy to read as the third and fourth charts:
    • the first is from all 5.7 releases on the medium server
    • the second is from all 5.7 releases on the small server
    • the third is from 5.7.30 to 5.7.39 on the medium server
    • the fourth is from every third 5.7 release on the medium server
  • The charts show relative throughput which is (QPS for $me / QPS for MySQL 5.7.10). When that value is less than one then the version is slower than MySQL 5.7.10.
Point queries, part 1

Summary
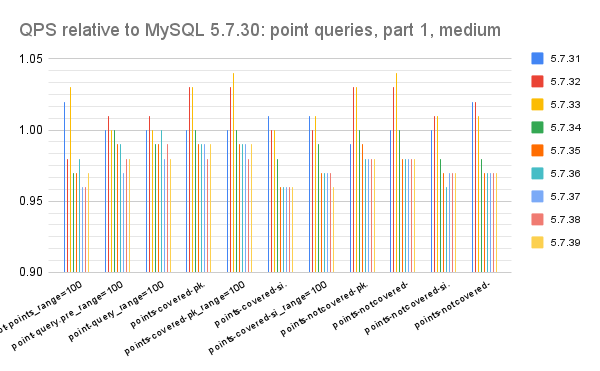
  • QPS for MySQL 5.7.43 is similar to 5.7.10 on the medium server. There were big improvements early in 5.7 and there have been gradual regressions since then.
  • QPS for MySQL 5.7.43 is about 5% less than 5.7.10 on the small server
Point queries, part 2

Summary
  • QPS for MySQL 5.7.43 is similar to 5.7.10 on the medium server. There were big improvements early in 5.7 and there have been gradual regressions since then.
  • QPS for MySQL 5.7.43 is about 5% less than 5.7.10 on the small server
Range queries, part 1

Summary
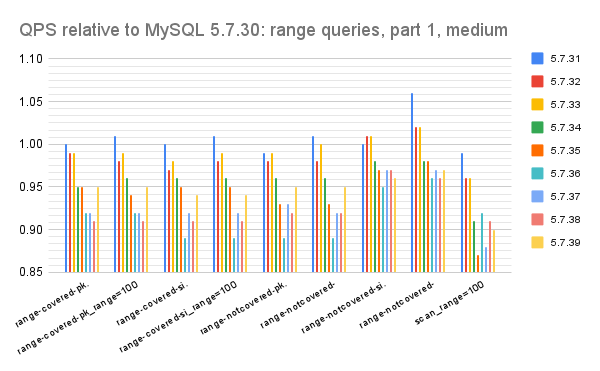
  • QPS for MySQL 5.7.43 is about 8% less than 5.7.10 on the medium server for most microbenchmarks
  • QPS for MySQL 5.7.43 on full table scans (scan_range=...) is about 21% less than 5.7.10 on the medium server
Range queries, part 2

Summary
  • QPS for MySQL 5.7.43 is similar to 5.7.10 on the medium server for most microbenchmarks
  • QPS for MySQL 5.7.43 is about 8% less than 5.7.10 when the range scan length is large
Writes

Summary
  • QPS for MySQL 5.7.43 is between 0% and 20% better than for 5.7.10

RocksDB on a big server: LRU vs hyperclock

This has benchmark results for RocksDB using a big (48-core) server. I ran tests to document the impact of the the block cache type (LRU vs ...