Saturday, December 21, 2019

What is the future of off-cpu analysis?

The answer is I don't know although I am really asking about tools I will use in 2020 and others will make different choices. I will have better answers in a few months. People have been telling me there is something better than PMP for many years. Perhaps that claim is finally true but this post from Percona suggests that PMP might have a future.

I start with Brendan Gregg when I want to learn about modern performance debugging and he has a page on off-cpu analysis. From there I learn eBPF, perf and bcc are the future and I hope that is true. For now I will summarize my use cases and potential solutions.

I have three use cases:
  1. Small server (< 10 cores) doing ~100k QPS on benchmarks
  2. Many-core server (<= 2 sockets, lots of cores/socket) doing x00k QPS on benchmarks.
  3. Servers in production
Stalls are more tolerable in the first two cases. Crashes and multi-second stalls in production are rarely acceptable. Although when a production server is extremely unhappy then a long stall or crash might be OK. Sometimes I want my long-running benchmarks to collect some thread stacks for off and on CPU analysis. This is more important for workloads that take days to setup. But I have yet to figure out how to exclude the impact from that when collecting throughput and response time metrics. This is more of an issue for off-cpu analysis versus using perf for on-cpu analysis as the impact from perf is smaller.

Some approaches, gdb and quickstack, have a per sample overhead which is probably linear in the number of thread stacks. I assume work done by gdb and quickstack to get stack traces is single-threaded which contributes to longer stalls on busier servers.

Other approaches like eBPF have an overhead that is independent of the number of samples -- the overhead is gone once samples have been collected. The overhead is probably linear in the amount of activity on the server (linear in the number of CPU cores) and I hope that much of it is handled in parallel -- each CPU core has more work to do when scheduling threads.

The possible approaches are:
  • Runtime - Java makes this easy with jstack. I am not sure whether gperftools and libunwind make this easy for C and C++.
  • PMP/gdb - Percona provides PMP via pt-pmp. Percona has a great post on fast ways to get thread stacks and I look forward to evaluating their advice. This might make PMP useful for the first two use cases listed above.
  • PMP/quickstack - quickstack is much faster than original PMP/gdb but was also less truthy. Regardless it made PMP much better in production.
  • eBPF - I am waiting for the eBPF book to arrive. Until then I have the web.

Friday, December 20, 2019

Readahead

Q: What is the best readahead size?
A: O_DIRECT

Perhaps I agree with Dr. Stonebraker. This is my answer which might not be the correct answer. My reasons for O_DIRECT are performance, quality of service (QoS) and manageability and performance might get too much attention. I don't dislike Linux but the VM, buffered IO, readahead and page cache are there for all Linux use cases. They must be general purpose. Complex system software like a DBMS isn't general purpose and can do its own thing when needed. Also, I appreciate that kernel developers have done a lot to make Linux better for a DBMS. One of the perks at FB was easy access to many kernel developers.

Most of my web-scale MySQL/InnoDB experience is with O_DIRECT. While InnoDB can use buffered IO we always chose O_DIRECT. Eventually, RocksDB arrived and it only did buffered IO for a few years. Then O_DIRECT support was added and perhaps one day the web-scale MyRocks team will explain what they use.

I deal with readahead when running benchmarks and a common experience is using the wrong (too large) value and then repeating tests which means I spend more time and more SSD endurance thanks to buffered IO. I have many blog posts with performance results for readahead including at least one for MongoDB. Usually my goal was to find which small value is good enough. I learned that 0 is too small. Readahead can help scan-heavy workloads, but my focus is on OLTP where we avoided most scans except for logical backup.

I understand why buffered IO is used by some DBMS. Early in the product lifecycle it can be a placeholder until more features are added to make O_DIRECT performant. The benefits of the OS page cache include:
  • Filesystem readahead can be used before the DBMS adds support for prefetching when doing scans. But filesystem readahead is a black box, might differ between filesystems, provides no metrics and will do the wrong thing for some workloads. InnoDB provides a prefetch feature which can help when O_DIRECT is used. I disabled it because OLTP. The Facebook MySQL team (thanks Nizam) added logical readahead to make logical backup faster and more efficient. Filesystem readahead is likely to struggle with index structure fragmentation, so it is best suited for heap-organized tables and will suffer with index scans.
  • Doing writes to the OS page cache followed by fsync can be used before the DBMS adds support for async IO or background write threads. But Postgres suffered for so long from this approach because calling fsync with an unknown amount of dirty pages in the OS page cache can starve all other pending IO requests for many seconds. The situation is less dire today thanks to work by Jens Axboe to make writeback less annoying. There was much discussion in 2014 at a summit that included Postgres and Linux kernel developers. In addition to Linux improvements, features have been added to Postgres to reduce the impact from writeback storms -- read this to learn about spread checkpoints.
  • For a DBMS that does compression it is easier to use the DBMS cache for uncompressed pages and the OS page cache for compressed pages. I am familiar with amazing work in InnoDB to manage both in the DBMS cache. We all agree the code is very complex. RocksDB also has an option to cache both in its block cache but I have little experience with the feature. It is hard to figure out the best way to divide the DBMS cache between compressed and uncompressed pages.

Performance advantages for O_DIRECT include:
  • Does one memory copy to move data from storage to the DBMS while buffered needs two
  • Avoids CPU and mutex contention overhead in the OS page cache
  • Avoids wasting memory from double buffering between the DBMS cache and OS page cache

QoS advantages for O_DIRECT include:
  • Filesystem readahead is frequently wrong and either wastes IO or favors the wrong user leading to worse IO response times for other users
  • OS page cache will get trashed by other services sharing the host
  • Writeback storms starve other IO requests. Writeback is usually a background task and can tolerate response time variance. Too much writeback makes user reads and log fsync slower and those operations don't want response time variance.
  • Reduces stalls - this is a placeholder because my local expert has yet to explain this in public. But you will have a better time with Linux when moving less data through the OS page cache, especially with modern storage devices that can sustain many GB/sec of throughput. And when you aren't having a good time then you can fix the DBMS. The DBMS is involved whether or not it relies on the OS page cache so you always have to make it work.

Manageability advantages for O_DIRECT include:
  • DBMS prefetch and writeback are documented, tunable and provide metrics. Such claims are less true for filesystem readahead and VM writeback. There is a lot of advice on the web and much disagreement especially on the topic of min_free_kbytes. Domas used to be my source on this but he doesn't blog enough about the Linux VM.

Tuesday, December 10, 2019

Slides for talks I have given on MySQL, MongoDB and RocksDB

It all started for me with the Google patch for MySQL in April 2007. The Register summary of that included a Cringely story repeated by Nick Carr that Google might have shared the patch as part of a plan to dominate IT via cloud computing. I thought that was ridiculous. AWS said hold my beer and brought us Aurora.

I donated to the Wayback Machine to offset my HW consumption for those links.

A list of talks from the RocksDB team is here.

This is an incomplete list of slide decks and videos from me:

Historical - summary of the Google MySQL effort

This summarizes work we did on MySQL at Google. These posts used to be shared at code.google.com but it was shutdown. After reformatting most of these (it was a fun day for me, but sorry for the spam) I remembered that somone had already done that in 2015. Thank you.

It all started for me with the Google patch for MySQL in April 2007. The Register summary of that included a Cringely story repeated by Nick Carr that Google might have shared the patch as part of a plan to dominate IT via cloud computing. I thought that was ridiculous. AWS said hold my beer and brought us Aurora.

My reformatted posts:

Posts from the git wiki pages via my fork of upstream:

Historical - InnoDB IO Performance

This post was shared on code.google.com many years ago but code.google has been shutdown. It describes work done by my team at Google. I am interested in the history of technology and with some spare time have been enable to republish it.

This is a collection from several posts about InnoDB IO performance

Max dirty pages

InnoDB provides a my.cnf variable, innodb_max_dirty_pages_pct, to set the maximum percentage of buffer pool pages that should be dirty. It then appears to ignores said variable for IO bound workloads (see this post from DimitriK). It doesn't really ignore the value. The problem is that it does not try hard enough to flush dirty pages even when there is available IO capacity. Specific problems include:
  • one thread uses synchronous IO to write pages to disk. When write latency is significant (because O_DIRECT is used, SATA write cache is disabled, network attached storage is used, ext2 is used) then this thread becomes a bottleneck. This was fixed in the v2 Google patch and is also fixed in MySQL 5.4 and Percona builds.
  • rate limits are too small. InnoDB has a background thread that schedules writes for 100 dirty pages at a time when there are too many dirty pages. The limit of 100 is reasonable for a single-disk server. It must be larger for a high IOPs server. The v2 Google patch, MySQL 5.4 (maybe) and Percona branches use the innodb_io_capacity my.cnf variable to determine the number of pages per second that should be written for this case and the amount of IO that should be done in other cases. All work is expressed as a fraction of this variable, rather than as a fixed number of IO operations.
  • request arrays are too small. On my servers, each array has 256 slots. For a server that can do 1000 IOPs, this is too small. The v4 patch makes the size of the array a function of the value of innodb_io.capacity
  • user sessions are not constrained. InnoDB delay's user sessions when the purge thread gets too far behind. Otherwise, not much is done to delay a user session. The v4 patch adds code to force user session's to stop and flush dirty pages when the maximum number of dirty pages has been exceeded. Hopefully, this code does nothing as the background thread is more likely to keep up given other changes in the v4 patch.

IO Performance

This provides performance results for work done to improve InnoDB IO performance. TODO - fix the links:

It is one thing to publish performance results. It is another to understand them. The results here need more analysis and the code needs to be tested by others in the community.

This describes work to make InnoDB faster on IO bound workloads. The goal is to make it easy to use InnoDB on a server that can do 1000 to 10000 IOPs. Many of problems must be fixed for that to be possible, but this is a big step towards that goal. These changes improve performance by 20% to more than 400% on several benchmarks. At a high level, these changes make InnoDB:
  • more efficient when processing IO requests
  • more likely to use available IO capacity
  • better at balancing different IO tasks
  • easier to monitor

One day, Heikki will write the Complete Guide to InnoDB (edit - Jeremy Cole did a lot to explain them), until then you need to consult multiple sources to understand the internals. It also helps to read the source code. These may help you to understand it:

Features

  • Changes the computation of the percentage of dirty buffer pool pages. Before this change the percentage exluded pages borrowed from the buffer pool for other uses. While that may be more accurate, it also requires the caller to lock/unlock a hot mutex. It also made the percentage vary a bit too much as the insert buffer grew and shrank. The v4 patch doesn't exclude the borrowed pages. As most of the borrowed pages should be used in the insert buffer and the insert buffer should be smaller (thanks to ibuf_max_pct_of_buffer), this is probably a good thing.
  • (edit removed many links to other project pages)

Background IO

InnoDB starts a thread, the main background IO thread, to perform background IO operations. This has operations that run once per second, once per 10 seconds and only when the server is idle. This is implemented with a for loop that iterates 10 times. Each time through the loop, the thread sleeps for 1 second unless too much work was done on the previous iteration of the loop. At the end of 10 iterations, the once per 10 seconds tasks are run.

It is hard to understand the behavior of this loop because the sleep is optional dependent on the amount of work done on the previous iteration of the loop. And there are costs from this complexity. For example, one of the 1 second tasks is to flush the transaction log to disk to match the expected behavior from innodb_flush_log_at_trx_commit=2. However, when the 1 second loop runs much more frequently than once per second there will be many more fsync calls then expected.

In the v4 patch, the sleep is not optional. Other changes to the main background IO thread make it possible for each loop iteration to do enough work that there is no need to skip the sleep.

In the v4 patch all of the code that submits a large number of async IO requests makes sure that the number of requests does not exceed the number of free slots in the array. Otherwise, the async IO requests block until there are free slots.

CPU overhead from IO

There are several factors that consume CPU time during IO processing:
  • checksum computation and verification - the v4 patch does not make this faster. Using -O3 rather than -O2 with gcc makes this faster. On a server that does 10,000 IOPs, this will consume a lot of CPU time. Domas wrote about this. We may need to consider alternative checksum algorithms and machine-specific optimizations.
  • request array iteration - InnoDB maintains requests for IO in an array. It frequently iterates on the array and called a function to get the next element in the array. That has been changed to use pointer arithmetic. This makes a big difference when the array is large.
  • request merging - InnoDB merges requests for adjacent blocks so that one large IO operation is done instead of several page size operations. Up to 64 page requests can be merged into one large (1MB) request. The merging algorithm was O(N*N) on the size of the request array and has been changed to be O(N). This will merge fewer requests but use much less CPU. A better change might be to replace each array with two lists: one that maintains requests in file order and the other in arrival order. But that must wait for another day.

my.cnf options for IO performance

These InnoDB my.cnf variables are new in the Google patches:
  • innodb_max_merged_io - maximum number of IO requests merged to issue large IO from background IO threads
  • innodb_read_io_threads - number of background read I/O threads in InnoDB
  • innodb_write_io_threads - number of background write I/O threads in InnoDB
  • innodb_adaptive_checkpoint - makes the background IO thread flush dirty pages when are there old pages that will delay a checkpoint. OFF provides traditional behavior
  • innodb_check_max_dirty_foreground - make user sessions flush some dirty pages when innodb_max_dirty_pages_pct has been exceeded. OFF provides traditional behavior
  • innodb_file_aio_stats - compute and export per-file IO statistics for InnoDB
  • innodb_flush_adjacent_background - when background IO threads flush dirty pages, flush adjacent dirty pages from the same extent. ON provides traditional behavior.
  • innodb_flush_adjacent_foreground - when user sessions flush dirty pages, flush adjacent dirty pages from the same extent. ON provides traditional behavior
  • innodb_ibuf_flush_pct - percent of innodb_io_capacity that should be used for prefetch reads used to merge insert buffer entries
  • innodb_ibuf_max_pct_of_buffer - soft limit for the percent of buffer cache pages that can be used for the insert buffer. When this is exceeded background IO threads work harder to merge insert buffer entries. The hard limit is 50%. The traditional value is 50%.
  • innodb_ibuf_reads_sync - use sync IO to read blocks for insert buffer merges. ON provides traditional behavior. 
  • innodb_io_capacity - maximum number of concurrent IO requests that should be done to flush dirty buffer pool pages. CAUTION -- setting this too high will use a lot of CPU to schedule IO requests and more than 1000 might be too high. The traditional value is 100.

Insert Buffer Improvements

InnoDB performance on many IO bound workloads is much better than expected because of the insert buffer. Unfortunately, InnoDB does not try hard enough to keep the insert buffer from getting full. And when it gets full it kills performance because it continues to use memory from the buffer pool but cannot be used to defer IO for secondary index maintenance.

The v4 patch has several changes to fix this:
  • the my.cnf variable innodb_ibuf_max_pct_of_buffer specifies a soft limit on the size of the buffer pool. The hard limit is 50%. When the hard limit is reached no more inserts are done to the insert buffer. When the soft limit is reached, the main background IO thread aggressively requests prefetch reads to merge insert buffer records.
  • the my.cnf variable innodb_ibuf_flush_pct specifies the number of prefetch reads that can be submitted at a time as a percentage of innodb_io_capacity. Prior to the v4 patch, InnoDB did 5 prefetch read requests at a time and this was usually done once per second.
  • the my.cnf variable innodb_ibuf_reads_sync determines whether async IO is used for the prefetch reads. Prior to the v4 patch, sync IO was used for the prefetch reads done to merge insert buffer records. This variable was added for testing as the default value (skip_innodb_ibuf_reads_sync) should be used in production.
  • code is added to delay user sessions and make them merge insert buffer records when the size of the insert buffer exceeds the soft limit.

Freeze InnoDB IO

This feature wasn't useful in production. It added the commands:
  • set global innodb_disallow_writes=ON
  • set global innodb_disallow_writes=OFF

These enable and disable all Innodb file system activity except for reads. If you want to take a database backup without stopping the server and you don't use LVM, ZFS or some other storage software that provides snapshots, then you can use this to halt all destructive file system activity from InnoDB and then backup the InnoDB data files. Note that it is not sufficient to run FLUSH TABLES WITH READ LOCK as there are background IO threads used by InnoDB that may still do IO.

Async IO for InnoDB

InnoDB supports asynchronous IO for Windows. For Linux, it uses 4 threads to perform background IO tasks and each thread uses synchronous IO. There is one thread for each of:
  • insert buffer merging
  • log IO
  • read prefetch requests
  • writing dirty buffer cache pages
InnoDB issues prefetch requests when it detects locality in random IO and when it detects a sequential scan. However, it only uses one thread to execute these requests. Multi-disk servers are best utilized when more IO requests can be issued concurrently.

For deployments that use buffered IO rather than direct IO or some type of remote disk (SAN, NFS, NAS), there is not much of a need for more write threads because writes complete quickly into the OS buffer cache. However, as servers with many GB of RAM are used, it is frequently better to use direct IO.

We changed InnoDB to support a configurable number of background IO threads for read and write requests. This is controlled by the parameters:
  • innodb_max_merged_io - Max number of IO requests merged to issue large IO from background IO threads
  • innodb_read_io_threads - the number of background IO threads for read prefetch requests
  • innodb_write_io_threads - the number of background IO threads for writing dirty pages from the buffer cache

Historical - Patch for MySQL 5.0

This post was shared on code.google.com many years ago but code.google has been shutdown. It describes work done by my team at Google. I am interested in the history of technology and with some spare time have been enable to republish it.

This describes the patch for MySQL 5.0 provided by my team at Google. The early patches from us were difficult for others because they tended to include too many diffs. I didn't have time to better. After I moved to FB Steaphan Greene undertook the heroic effort to do proper diff management and the team has continued to follow his example.

Introduction

The code has been changed to make MySQL more manageable, available and scaleable. Many problems remain to be solved to improve SMP performance. This is a good start. The v3 patch and all future patches will be published with a BSD license which applies to code we have added and changed. Original MySQL sources has a GPL license.

I am not sure if the patches were lost after the googlecode shutdown.

These have the same functionality as the MySQL 4 patches. There are several patch sets:
  • v1 patch published in 2007
  • v2 patch with all of our changes for MySQL 5.0.37
  • v3 patch with all of our changes for MySQL 5.0.37 as of May 6, 2009. This adds global transaction IDs, row-change logging and more InnoDB SMP performance fixes.
  • v4 patch [http://google-mysql-tools.googlecode.com/svn/trunk/old/mysql-as of June 1, 2009
  • semisync v1 patch published in 2007
  • mutexstats patch MySQL 5.1.26
  • SMP perf patch for MySQL 5.0.67. This has two changes:
    • use atomic memory instructions for the InnoDB mutex and rw-mutex. This is only done for x86 platforms that use a recent (>= 4.1) version of GCC.
    • disable the InnoDB memory heap. This is done for all platforms
  • SMP plugin for the InnoDB 1.0.1 plugin in MySQL 5.1
  • Patch to enable/disable IO to InnoDB files for MySQL 5.0.37
  • Patch to use pthread_mutex_t instead of mutex_t for rw_lock_struct::mutex in InnoDB
  • Patch for global transaction IDs and binlog event checksums stand-alone patch] extracted out of the big V3 patch and ported to mysql-5.0.68 as of 

Feedback, Problems and Comments

Use the deprecated Google group.

Disclaimer

We have changed a lot of code. Not all of the changes are described here and some of the changes to default behavior from new my.cnf variables can break your applications. Unless your name rhymes with Domas, it might be better to take pieces of the patch rather than try to use all of it.

The code has been tested on 32-bit and 64-bit Linux x86. We may have broken the build for other platforms.

The embedded server, *--with-embedded-server*, cannot be built with these changes. We have broken the build for it.

Many of the Makefile.in and Makefile.am files have been changed in the big patch because we changed InnoDB to use the top-level configure.

If you try to install the big patch, treat it like [http://dev.mysql.com/doc/refman/5.0/en/installing-source-tree.html installing from a source tree].

Authors

Many people contributed to this:
  • Wei Li
  • Gene Pang
  • Eric Rollins
  • Ben Handy
  • Justin Tolmer
  • Larry Zhou
  • Yuan Wei
  • Robert Banz
  • Chip Turner
  • Steve Gunn
  • Mark Callaghan

The v2 patch

This has many new features and a few non-features. Embedded MySQL will not work with this patch.
  • SqlChanges
  • SemiSyncReplication
  • InnodbSmp
  • NewShowStatus
  • NewShowInnodbStatus
  • NewConfiguration
  • UserTableMonitoring
  • TransactionalReplication
  • MysqlRoles
  • MysqlRateLimiting
  • MoreLogging
  • InnodbAsyncIo
  • FastMasterPromotion
  • MirroredBinlogs
  • InnodbSampling
  • NewSqlFunctions
  • InnodbStatus
  • LosslessFloatDump
  • MysqlHttp
  • InnodbIoTuning
  • MutexContentionStats
  • FastMutexes
  • InnodbFreeze

The v3 patch

This has many new features and a few non-features. Embedded MySQL will not work with this patch. Also, I generated the patch after running 'make distclean' so there are some files that must be regenerated after this patch is applied, including sql_yacc.cc and sql_yacc.h. By doing this, the patch diff is smaller but maybe a bit confusing. Also, I did not update any of the files in libmysqld/ that are copied from sql/.
  • GlobalTransactionIds
  • OnlineDataDrift
  • BatchKeyAccess
  • InnodbMutexContention2
  • BinlogEventChecksums

The v4 patch

This makes InnoDB much faster on IO bound workloads and fixes bugs in new features.
  • InnodbIoPerformance

Not yet released
  • MysqlThreadPool

Historical - Make User Delayed

This post was shared on code.google.com many years ago but code.google has been shutdown. It describes work done by my team at Google. I am interested in the history of technology and with some spare time have been enable to republish it.

I added support to rate limit DBMS accounts that were too busy. It wasn't successful in production for the obvious reason that it just shifts the convoy from the database to the app server -- the problem still exists. The better solution is to fix the application or improve DBMS capacity but that takes time.

This describes SQL commands added to rate limit queries per account and per client IP.

Per account rate limiting

Per-account query delays use new SQL commands to set a query delay for an account. The delay is the number of milliseconds to sleep before running a SQL statement for the account. These values are transient and all reset to zero delay on server restart. The values are set by the command MAKE USER 'user' DELAYED 100 where the literals user and 100 are the account and number of milliseconds to sleep. There is no delay when the value is 0. The values are displayed by the command SHOW DELAYED USER.

MySQL had a feature to limit the number of queries per hour for an account. This is done by setting the _user.max_questions_ column for the account. We have changed this to be the max queries per minute so that when an account reaches the limit, it doesn't have to wait for an hour for the reset.

These don't change the behavior for existing connections. There must be a reconnect to get the new values.

Per client IP rate limiting

Per-client rate limiting is done by the command MAKE CLIENT 'IP-address' DELAYED 100 where the literal IP-address is the exact match for the client IP that should be delayed and 100 is the number of milliseconds to delay each statement. The delays are displayed by the command SHOW DELAYED CLIENT.

Historical - Adding Roles to MySQL

This post was shared on code.google.com many years ago but code.google has been shutdown. It describes work done by my team at Google. I am interested in the history of technology and with some spare time have been enable to republish it.

I added support for roles to MySQL circa 2008. They arrived upstream with MySQL 8 in 2018. I wasn't able to wait. I enjoyed the project more than expected. It wasn't hard in terms of algorithms or performance but I had to avoid mistakes to avoid security bugs and the upstream code was well written. I had a similar experience implementing BINARY_FLOAT and BINARY_DOUBLE at Oracle. There I got to learn about the IEEE754 standard and had to go out of my way to catch all of the corner cases. Plus I enjoyed working with Minghui Yang who did the PL/SQL part of it.

MySQL roles and mapped users

The access control model in MySQL does not scale for a deployment with thousands of accounts and thousands of tables. The problems are that similar privileges are specified for many accounts and that the only way to limit an account from accessing a table is to grant privileges at the table or column level in which case the mysql.user table has millions of entries.

Privileges may be associated once with a role, and then many accounts may be mapped to that role. When many accounts have the same privileges, this avoids the need to specify the privileges for each account.

We have implemented mapped users in the MySQL access control model. These are used to simulate roles and solve one of these problems. A mapped user provides authentication credentials and is mapped to a _role_ for access control. A new table, mysql.mapped_user, has been added to define mapped users. Entries in an existing table, mysql.user, are reused for roles when there are entries from mysql.mapped_user that reference them.

To avoid confusion:
  • mapped user - one row in mysql.mapped_user
  • role - one row in mysql.user referenced by at least one row in mysql.mapped_user

This provides several features:
  • multiple passwords per account
  • manual password expiration
  • roles
  • transparent to users (mysql -uuser -ppassword works regardless of whether authentication is done using entries in mysql.mapped_user or mysql.user)

Use Case

Create a role account in mysql.user. Create thousands of private accounts in mysql.mapped_user that map to the role. By map to I mean that the value of mysql.mapped_user.Role is the account name for the role.

Implementation

Authentication in MySQL is implemented using the _mysql.user_ table. mysqld sorts these entries and when a connection is attempted, the first entry in the sorted list that matches the account name and hostname/IP of the client is used for authentication. A challenge response protocol is done using the password hash for that entry.
A new table is added to support mapped users. This table does not have columns for privileges. Instead, each row references an account name from mysql.user that provides the privileges. The new table has a subset of the columns from mysql.user:
  • User - the name for this mapped user
  • Role - the name of the account in mysql.user from which this account gets its privileges
  • Password - the password hash for authenticating a connection
  • PasswordChanged - the timestamp when this entry was last updated or created. This is intended to support manual password expiration via a script that deletes all entries where PasswordChanged less than the cutoff.
  • ssl_type, ssl_cipher, x509_issuer, x509_subject - values for SSL authentication, note that code has yet to be added in the server to handle these values

DDL for the new table:
CREATE TABLE mapped_user (
  User char(16) binary DEFAULT '' NOT NULL,
  Role char(16) binary DEFAULT '' NOT NULL,
  Password char(41) character set latin1 collate latin1_bin DEFAULT '' NOT NULL,
  PasswordChanged Timestamp DEFAULT CURRENT_TIMESTAMP ON UPDATE CURRENT_TIMESTAMP NOT NULL,
  ssl_type enum('','ANY','X509','SPECIFIED') character set utf8 NOT NULL default '',
  ssl_cipher blob NOT NULL,
  x509_issuer blob NOT NULL,
  x509_subject blob NOT NULL,
  PRIMARY KEY (User, Role, Password)
) engine=MyISAM
CHARACTER SET utf8 COLLATE utf8_bin
comment='Mapped users';

Authentication

Entries from mysql.mapped_user are used to authenticate connection attempts only when authentication fails with entries in mysql.user. The failure may have occurred because there was no entry in mysql.user for the user/host or because the password was wrong. If authentication succeeds using an entry in mysql.mapped_user, the mysql.mapped_user.Role column in that entry and the client's hostname/IP are used to search mysql.user for a matching entry. And if one is found, that entry provides the privileges for the connection. By provides the privileges I mean that:
  • the values of mysql.user.User and mysql.user.Host are used to search the other privilege tables
  • the global privileges stored in mysql.user for the matching entry are used

The mysql.mapped_user table supports multiple passwords per account. When a user tries to create a connection with a username that is in the mysql.mapped_user table and there are multiple entries with a matching value in mysql.mapped_user.User, then authentication is attempted for one entry at a time using the password hash in mysql.mapped_user.Password until authentication succeeds or there are no more entries. Note that the order in which the entries from mysql.mapped_user are checked is *not* defined, but this is only an issue when there are entries in mysql.mapped_user with the same value for _User_ and different values for _Role_ and that deployment model should not be used. Also note that this does not require additional RPCs during client authentication.

Entries are ignored from mysql.mapped_user when:
  • Role is the empty string
  • User is the empty string
  • Password is the empty string

There is no constraint between the values in mysql.mapped_user.User and mysql.user.User.  Thus, a bogus mapping (Role references an account that does not exist in mysql.user) can be created. In that case, the entry in mysql.mapped_user cannot be used to create connections and will get access denied errors.

There is a primary key index on mysql.mapped_user, but that is not sufficient to enforce all of the integrity constraints that are needed. Entries with the same values for User and Role but different passwords are allowed, and the primary key forces the password to be different. Entries with the same value for User but different values for _Role_ should not be allowed. However, this can only be enforced with a check constraint on the table and MySQL does not enforce check constraints. We can write a tool to find such entries.

SQL Interfaces

Roles can be added via the _create mapped user_ command that is similar to create user but extended to support options for SSL connections. Roles can be dropped by the drop mapped user command that is similar to drop user. These commands update internal data structures and update the mysql.mapped_user table. There is no need to run flush privileges with these commands.

The following have been changed to print the value of mysql.mapped_user.User rather than the value of mysql.user.User when a role is used to create a connection.
  • error messages related to access control
  • select current_user()
  • select user()
  • show user_statistics
  • show processlist

The output of show grants has not been changed and will display the privileges for the role (the entry in _mysql.user).

set password = password(STRING)_ fails for accounts that use a role. The only way to change a password for an entry in mysql.mapped_user is by an insert statement.

how processlist with roles displays the role for connections from mapped users rather than the mapped user name. show processlist displays the value from mysql.mapped_user.

show user_statistics with roles displays statistics aggregated by role for connections from mapped users. show user_statistics displays values aggregated by the value from mysql.mapped_user.

Mapped users can be created by inserting into mysql.mapped_user and then running FLUSH PRIVILEGES. They are also created by the _create mapped user_ command. An example is create mapped user mapped_readonly identified by 'password' role readonly.

Mapped users can be dropped by deleting from mysql.mapped_user and then running FLUSH PRIVILEGES. They are also dropped by the _drop mapped user_ command. An example is *drop mapped user foo*. This drops all entries from mysql.mapped_user with that user name. A delete statement must be used to drop an entry matching either (username, role) or (username, role, password).

select user() displays the value of the mapped user name when connected as a mapped user. select current_user() displays the value of the role when connected as a mapped user. This is done because current_user() is defined to return the name of the account used for access control.

make user delayed is done on the value of the account name. It does not matter whether the account is listed in mysql.user or mysql.mapped_user.

mysql.mapped_user does not have columns for resource limits such as max connections and max QPS. Limits are enforced per role.

This feature is only supported when the configuration variable mapped_users is used (add to /etc/my.cnf). This feature is disabled by default. Also, the mysql.mapped_user table must exist. This table does not exist in our current deployment. It must be created before the feature is enabled. The scripts provided by MySQL to create the system databases will create the table, but we do not use those scripts frequently.

The value of the mysql.user.Host column applies to any mapped users trying to create a connection. This can be used to restrict clients to connect from prod or corp hosts.

Open Requests
  • Add a unique index on (User, Password)
  • Add an email column to mysql.mapped_user
  • Inherit limits (hostname/IP address from which connections are allowed, connection limits, max queries per minute limit) from the mysql.user table.
  • Implement support for SSL -- the mysql.mapped_user table has columns for SSL authentication. Code has not been added to the server to handle them.


Historical - changes to my.cnf

This post was shared on code.google.com many years ago but code.google has been shutdown. It describes work done by my team at Google. I am interested in the history of technology and with some spare time have been enable to republish it.

TODO - find the linked pages including:
  • MysqlHttp - we added an http server to mysql for exporting monitoring. This was work by Nick Burrett
  • InnodbAsyncIo - this explains perf improvements we made for InnoDB
  • InnoDbIoTuning - explains more perf improvements we made for InnoDB

We added these options:
  • http_enable - start the embedded HTTP demon when ON, see MysqlHttp
  • http_port - port on which HTTP listens, see MysqlHttp
  • innodb_max_merged_io - max number of IO requests merged into one large request by a background IO thread
  • innodb_read_io_threads, innodb_write_io_threads - number of background IO threads for prefetch reads and dirty page writes, see InnodbAsyncIo
  • show_command_compatible_mysql4 - make output from some SHOW commands match that used by MySQL4
  • show_default_global - make SHOW STATUS use global statistics
  • global_status_update_interval - the interval at which per-thread stats are read for SHOW STATUS. When SHOW STATUS is run more frequently cached values are used rather than locking and reading data from each thread.
  • google_profile[=name] - enable profiling using Google Perftools and write output to this file. Server must have been compiled to use Google Perftools.
  • equality_propagation - enables use of equality propagation in the optimizer because the overhead was too much in a few releases (bug filed & fixed)
  • trim_trailing_blanks - trim trailing blanks on varchar fields when set
  • allow_view_trigger_sp_subquery - allow use of views, triggers, stored procedures and subqueries when set
  • allow_delayed_write - allow use of delayed insert and replace statements
  • local-infile-needs-file - LOAD DATA LOCAL INFILE requires the FILE privilege when set  
  • audit_log[=name] - log logins, queries against specified tables, and startup
  • audit_log_tables=name - log queries that use these tables to the audit log (comma separated)
  • log_root - log DML done by users with the SUPER privilege
  • repl_port[=#] - extra port on which mysqld listens for connections from users with SUPER and replication privileges
  • rpl_always_reconnect_on_error - slave IO thread always tries to reconnect on error when set
  • rpl_always_enter_innodb - slave SQL thread always enter innodb when set regardless of innodb concurrency ticket count
  • rpl_event_buffer_size=# - size of the per-connection buffer used on the master to copy events to a slave. Avoids allocating/deallocating a buffer for each event.
  • reserved_super_connections=# - number of reserved connections for users with SUPER privileges.
  • rpl_always_begin_event - always add a BEGIN event at the beginning of each transaction block written to the binlog. This fixes a bug.
  • rpl_semi_sync_enabled - enable semisync replication on a master
  • rpl_semi_sync_slave_enabled - semisync replication on a slave
  • rpl_semi_sync_timeout - timeout in milliseconds for semisync replication in the master
  • rpl_semi_sync_trace_level - trace level for debugging for semisync replication
  • rpl_transaction_enabled - use transactional replication on a slave
  • innodb_crash_if_init_fails - crash if InnoDB initialization fails
  • innodb_io_capacity - number of disk IOPs the server can do, see InnodbIoTuning
  • innodb_extra_dirty_writes - flush dirty buffer pages when dirty pct is less than max dirty pct
  • connect_must_have_super - only connections with SUPER_ACL, REPL_SLAVE_ACL or REPL_CLIENT_ACL are accepted (yes, this is dynamic)
  • readonly_databases - prevents writes to any DB except for mysql
  • readonly_mysql - prevents writes to mysql DB will fail.
  • fixup_binlog_end_pos - fix for MySQL bug 23171 which updates the end_log_pos of  binlog events as they are written to the  bin log
  • log_slave_connects - log connect and disconnect messages for replication slaves
  • mapped_users - use the mapped_user table to map users to roles
  • xa_enabled - enable support for XA transactions (I like to disable this)

Historical - SHOW INNODB STATUS

This post was shared on code.google.com many years ago but code.google has been shutdown. It describes work done by my team at Google. I am interested in the history of technology and with some spare time have been enable to republish it.

MySQL circa 2008 was hard to monitor so we added many things to SHOW STATUS and SHOW INNODB STATUS along with support for user, table and index statistics. Most of the changes we made to SHOW INNODB STATUS are not listed here. I am not sure whether I ever described them. The most important changes were:
  • list transactions last in the output in case the output was too long and truncated by InnoDB
  • report average and worst-case IO latencies

Introduction

We have added more output to SHOW INNODB STATUS, reordered the output so that the list of transactions is printed list and increased the maximum size of the output that may be returned.

Background threads:
  • srv_master_thread_loops - counts work done by main background thread
  • spinlock delay displays the number of milliseconds that the spinlock will spin before going to sleep
  • fsync callers displays the source of calls to fsync()
----------
BACKGROUND THREAD
----------
srv_master_thread loops: 28488 1_second, 28487 sleeps, 2730 10_second, 1182 background, 761 flush
srv_master_thread log flush: 29146 sync, 2982 async
srv_wait_thread_mics 0 microseconds, 0.0 seconds
spinlock delay for 5 delay 20 rounds is 5 mics
fsync callers: 1034231 buffer pool, 39227 other, 73053 checkpoint, 10737 log aio, 80994 log sync, 0 archive
Semaphores

New output includes:
  • lock wait timeouts counter
  • number of spinlock rounds per OS wait for a mutex
----------
SEMAPHORES
----------
Lock wait timeouts 0
...
Spin rounds per wait: 2.90 mutex, 1.27 RW-shared, 3.04 RW-excl

Disk IO

New output includes:
  • number of pages read/written
  • number of read/write system calls used to read/write those pages
  • time in milliseconds to complete the IO requests
--------
FILE I/O
--------
I/O thread 0 state: waiting for i/o request (insert buffer thread) reads 24 writes 0 requests 14 io secs 0.033997 io msecs/request 2.428357 max_io_wait 18.598000
I/O thread 1 state: waiting for i/o request (log thread) reads 0 writes 10737 requests 10737 io secs 30.626824 io msecs/request 2.852456 max_io_wait 710.588000
I/O thread 2 state: waiting for i/o request (read thread) reads 136659 writes 0 requests 118296 io secs 3093.412099 io msecs/request
26.149761 max_io_wait 2631.029000
I/O thread 3 state: waiting for i/o request (read thread) reads 91262 writes 0 requests 71709 io secs 1900.155508 io msecs/request 26.498145 max_io_wait 1626.209000
I/O thread 6 state: waiting for i/o request (write thread) reads 0 writes 1847360 requests 7065434 io secs 1063.904923 io msecs/request 0.150579 max_io_wait 2569.244000

This is from another post

There are more details on InnoDB status in the output from SHOW INNODB STATUS and SHOW STATUS.

New details for SHOW INNODB STATUS include:
  • frequency at which the main background IO thread runs
  • IO latency for each background IO thread
  • per-file IO statistics
  • insert buffer prefetch reads
  • statistics on checkpoint related IO
  • statistics on prefetches
  • statistics on sources of background IO

Main background IO thread

This includes:

  • srv_master_thread loops - number of iterations of the main background loop including the tasks per second (1_second) and the tasks per 10 seconds (10_second).
  • Seconds in background IO thread: number of seconds performing different background IO tasks

BACKGROUND THREAD
----------
srv_master_thread loops: 1623 1_second, 1623 sleeps, 162 10_second, 1 background, 1 flush
srv_master_thread log flush: 1785 sync, 1 async
srv_wait_thread_mics 0 microseconds, 0.0 seconds
spinlock delay for 5 delay 20 rounds is 2 mics
Seconds in background IO thread: 5.10 insert buffer, 49.02 buffer pool, 0.00 adaptive checkpoint, 52.34 purge
fsync callers: 0 buffer pool, 189 other, 1323 checkpoint, 263 log aio, 5179 log sync, 0 archive

Background IO thread statistics

This includes:
  • reads, writes - number of pages read and written
  • requests - number of pwrite/pread system calls. There may be fewer of these than reads and writes because of request merging.
  • msecs/r - average number of milliseconds per *request*. For the *io:* section this is the time for the pwrite/pread system call. For the *svc:* section this is the time from when the page is submitted to the background thread until it is completed.
  • secs - total seconds for all pread/pwrite calls
  • old - number of pages for which the service time is greater than 2 seconds
  • Sync reads, Sync writes - IO operations done synchronously. These share code with the background IO threads, but the IO calls are done directly rather than begin put in the request array and handled by a background IO thread.

FILE I/O
--------
I/O thread 0 state: waiting for i/o request (insert buffer thread) reads 2177 writes 0 io: requests 125 secs 2.99 msecs/r 23.90 max msecs 82.07 svc: 106.58 msecs/r 48.96 max msecs 128.76 old 0
I/O thread 1 state: waiting for i/o request (log thread) reads 0 writes 263 io: requests 263 secs 0.13 msecs/r 0.49 max msecs 30.43 svc: secs 0.14 msecs/r 0.54 max msecs 30.48 old 0
I/O thread 2 state: doing file i/o (read thread) reads 116513 writes 0 io: requests 35777 secs 564.96 msecs/r 15.79 max msecs 251.04 svc: secs 7643.21 msecs/r 65.60 max msecs 2492.18 old 111 ev set
I/O thread 6 state: waiting for i/o request (write thread) reads 0 writes 391586 io: requests 256597 secs 1169.16 msecs/r 4.56 max msecs 336.70 svc: secs 104498.79 msecs/r 266.86 max msecs 3001.04 old 169
Sync reads: requests 10126259, pages 10126278, bytes 165912465408, seconds 171656.02, msecs/r 16.95
Sync writes: requests 2849234, pages 3029512, bytes 11289789952, seconds 77.81, msecs/r 0.03

File IO statistics

This includes statistics per file. It is much more useful when InnoDB is run with innodb_file_per_table. The first two columns are the tablespace name and tablespace ID. There are separate sections for reads and writes per file:
  • pages - number of pages read or written
  • requests - number of pwrite/pread system calls. There may be fewer of these than reads and writes because of request merging
  • msecs/r - average number of milliseconds per request
  • secs - total seconds for all pread/pwrite calls

File IO statistics
  ./test/warehouse.ibd 10 -- read: 3 requests, 3 pages, 0.01 secs, 4.36 msecs/r, write: 30 requests, 30 pages, 0.11 secs, 3.70 msecs/r
  ./ibdata1 0 -- read: 1123 requests, 3349 pages, 22.97 secs, 20.46 msecs/r, write: 2662 requests, 86526 pages, 32.86 secs, 12.34 msecs/r
  ./test/orders.ibd 29 -- read: 26301 requests, 28759 pages, 450.63 secs, 17.13 msecs/r, write: 82089 requests, 101564 pages, 425.44 secs, 5.18 msecs/r
  ./test/customer.ibd 28 -- read: 333186 requests, 338048 pages, 5955.39 secs, 17.87 msecs/r, write: 185378 requests, 200494 pages, 883.61 secs, 4.77 msecs/r
  ./test/stock.ibd 27 -- read: 902675 requests, 1179864 pages, 16036.91 secs, 17.77 msecs/r, write: 577970 requests, 790063 pages, 2473.27 secs, 4.28 msecs/r
  ./test/order_line.ibd 25 -- read: 74232 requests, 92644 pages, 1217.65 secs, 16.40 msecs/r, write: 141432 requests, 274155 pages, 643.97 secs, 4.55 msecs/r
  ./test/new_orders.ibd 22 -- read: 4642 requests, 4960 pages, 81.02 secs, 17.45 msecs/r, write: 11482 requests, 60368 pages, 103.86 secs, 9.05 msecs/r
  ./test/history.ibd 21 -- read: 8006 requests, 11323 pages, 123.86 secs, 15.47 msecs/r, write: 24640 requests, 52809 pages, 119.01 secs, 4.83 msecs/r
  ./test/district.ibd 18 -- read: 14 requests, 14 pages, 0.14 secs, 10.35 msecs/r, write: 39 requests, 249 pages, 0.43 secs, 10.96 msecs/r
  ./test/item.ibd 16 -- read: 2892 requests, 3033 pages, 51.96 secs, 17.97 msecs/r, write: 0 requests, 0 pages, 0.00 secs, 0.00 msecs/r
  ./ib_logfile0 4294967280 -- read: 6 requests, 9 pages, 0.00 secs, 0.02 msecs/r, write: 314701 requests, 316680 pages, 6.73 secs, 0.02 msecs/w

Insert Buffer Statistics

New output includes:
  • Ibuf read pages - number of requested and actual prefetch reads done to merge insert buffer records. InnoDB chooses entries to merge at random. If the number requested is much higher than the actual number, then the random algorithm is inefficient.
  • Ibuf merge - rate at which work is done for the insert buffer

INSERT BUFFER AND ADAPTIVE HASH INDEX
-------------------------------------
Ibuf: size 3776, free list len 1895, seg size 5672,
984975 inserts, 454561 merged recs, 58782 merges
Ibuf read pages: 32960 requested, 36280 actual
Ibuf merge: 1229.9 requested_io/s, 39269.4 records_in/s, 19639.5 records_out/s, 2210.6 page_reads/s

Log Statistics

This includes:
  • Foreground (Background) page flushes - page flushes done synchronously (asynchronously) by user sessions to maintain a small number of clean buffer pool pages. 

LOG
---
Foreground page flushes:  sync 0 async 0
Background adaptive page flushes: 0
Foreground flush margins: sync 3025130459 async 2823455095
Space to flush margin:     sync 3000381113 async 2798705749
Current_LSN - Min_LSN     24749346
Checkpoint age            25858470
Max checkpoint age        3226805822

Buffer Pool Statistics

This includes:
  • LRU_old pages - number of *old* pages on the LRU list
  • Total writes - sources of pages for dirty page writes
  • Write sources - callers from which dirty page write requests are submitted
  • Foreground flushed dirty - number of dirty page writes submitted from a user session because the main background IO thread was too slow
  • Read ahead - number of prefetch read requests submitted because random or sequential access to an extent was detected
  • Pct_dirty - percent of pages in the buffer pool that are dirty

BUFFER POOL AND MEMORY
----------------------
LRU_old pages      48109
Total writes: LRU 23271, flush list 1491363, single page 0
Write sources: free margin 23271, bg dirty 552374, bg lsn 0, bg extra 2742, recv 0, preflush 0
Foreground flushed dirty 935903
Read ahead: 44312 random, 355282 sequential
Pct_dirty 25.83

Historical - SHOW STATUS changes

This post was shared on code.google.com many years ago but code.google has been shutdown. It describes work done by my team at Google. I am interested in the history of technology and with some spare time have been enable to republish it.

MySQL circa 2008 was hard to monitor so we added many things to SHOW STATUS and SHOW INNODB STATUS along with support for user, table and index statistics.

I added a counter for failures of calls to gettimeofday. That used to be a thing. We also changed mysqld to catch cross-socket differences in hardware clocks on old AMD motherboards. Fun times.

Overview

We have added extra values for monitoring. Much of the data from SHOW INNODB STATUS is now available in SHOW STATUS.

We have also added rate limiting for both SHOW STATUS and SHOW INNODB STATUS to reduce the overhead from overzealous monitoring tools. This limits how frequently the expensive operations are done for these SHOW commands.

Changes

General
  • Binlog_events - number of replication events written to the binlog
  • Binlog_largest_event - larget event in the current binlog
  • Denied_connections - number of connection attempts that fail because of the max_connections limit
  • Malloc_sbrk_bytes_alloc, Malloc_chunks_free, Malloc_mmap_chunks_alloc, Malloc_mmap_bytes_alloc, Malloc_bytes_used, Malloc_bytes_free - values reported from mallinfo()
  • Gettimeofday_errors - errors for gettimeofday calls (yes, this happens)
  • Sort_filesort_old - number of times the old filesort algorithm is used
  • Sort_filesort_new - number of times the new filesort algorithm is used

Replication
  • Replication_fail_io_connections - on a slave, number of times the IO thread has disconnected from the master because of an error
  • Replication_total_io_connections - number of connections made by the IO thread to the master
  • Replication_last_event_buffered - on a slave, time when last replication event received
  • Replication_last_event_done - on a slave, time when last replication event replayed

Semi-synchronous replication
  • Rpl_semi_sync_clients - number of semi-sync clients connected to a master
  • Rpl_semi_sync_net_avg_wait_time(us) - average time to wait for an acknowledgement of a replication event from a semi-sync slave
  • Rpl_semi_sync_net_wait_time - total time waiting for acknowledgement
  • Rpl_semi_sync_net_waits
  • Rpl_semi_sync_no_times  
  • Rpl_semi_sync_no_tx - number of transactions not acknowledged by semi-sync slaves
  • Rpl_semi_sync_status - indicates whether semi-sync is enabled
  • Rpl_semi_sync_slave_status 
  • Rpl_semi_sync_timefunc_failures
  • Rpl_semi_sync_tx_avg_wait_time(us) - average time a sessions waits for commit to finish
  • Rpl_semi_sync_tx_wait_time
  • Rpl_semi_sync_tx_waits
  • Rpl_semi_sync_wait_pos_backtraverse
  • Rpl_semi_sync_wait_sessions
  • Rpl_semi_sync_yes_tx - number of transactions acknowledged by semi-sync slaves
  • Rpl_transaction_support

Innodb
  • Innodb_dict_size - number of bytes used for the InnoDB dictionary
  • Innodb_have_atomic_builtins - indicates whether InnoDB uses atomic memory operations in place of pthreads synchronization functions
  • Innodb_heap_enabled - indicates  whether the InnoDB malloc heap was enabled -- see bug 38531
  • Innodb_long_lock_wait - set when there is a long lock wait on an internal lock. These usually indicate an InnoDB bug. They also occur because the adaptive hash latch is not always released when it should be (such as during an external sort).
  • Innodb_long_lock_waits - incremented once for each internal long lock wait
  • Innodb_os_read_requests - from SHOW INNODB STATUS
  • Innodb_os_write_requests - from SHOW INNODB STATUS
  • Innodb_os_pages_read - from SHOW INNODB STATUS
  • Innodb_os_pages_written - from SHOW INNODB STATUS
  • Innodb_os_read_time - from SHOW INNODB STATUS
  • Innodb_os_write_time - from SHOW INNODB STATUS
  • Innodb_time_per_read - average microseconds per read
  • Innodb_time_per_write - average microseconds per write
  • Innodb_deadlocks - application deadlocks, detected automatically
  • Innodb_transaction_count - from SHOW INNODB STATUS
  • Innodb_transaction_purge_count - from SHOW INNODB STATUS
  • Innodb_transaction_purge_lag - count of work to be done by the InnoDB purge thread, see this post
  • Innodb_active_transactions - from SHOW INNODB STATUS
  • Innodb_summed_transaction_age - from SHOW INNODB STATUS
  • Innodb_longest_transaction_age - from SHOW INNODB STATUS
  • Innodb_lock_wait_timeouts - count of lock wait timeouts
  • Innodb_lock_waiters - from SHOW INNODB STATUS
  • Innodb_summed_lock_wait_time - from SHOW INNODB STATUS
  • Innodb_longest_lock_wait - from SHOW INNODB STATUS
  • Innodb_pending_normal_aio_reads - from SHOW INNODB STATUS
  • Innodb_pending_normal_aio_writes - from SHOW INNODB STATUS
  • Innodb_pending_ibuf_aio_reads - from SHOW INNODB STATUS
  • Innodb_pending_log_ios - from SHOW INNODB STATUS
  • Innodb_pending_sync_ios - from SHOW INNODB STATUS
  • Innodb_os_reads - from SHOW INNODB STATUS
  • Innodb_os_writes - from SHOW INNODB STATUS
  • Innodb_os_fsyncs - from SHOW INNODB STATUS
  • Innodb_ibuf_inserts - from SHOW INNODB STATUS
  • Innodb_ibuf_size - counts work to be done by the insert buffer, see here
  • Innodb_ibuf_merged_recs - from SHOW INNODB STATUS
  • Innodb_ibuf_merges - from SHOW INNODB STATUS
  • Innodb_log_ios_done - from SHOW INNODB STATUS
  • Innodb_buffer_pool_hit_rate - from SHOW INNODB STATUS

Historical - design doc for semisync replication

This can be read along with the initial semisync post. This post was shared on code.google.com many years ago but code.google has been shutdown. It describes work done by my team at Google. I am interested in the history of technology and with some spare time have been enable to republish it.

Semisync replication was designed and implemented by Wei Li. He did a lot of work to make replication better for web-scale and then moved away from MySQL. Upstream reimplemented the feature which was a good decision given the constraints on our implementation time.

Introduction

Semi-sync replication blocks return from commit on a master until at least one slave acknowledges receipt of all replication events for that transaction. Note that the transaction is committed on the master first.

Background

MySQL replication is asynchronous. If a master fails after committing a transaction but before a slave copied replication events for that transaction, the transaction might be lost forever. For some deployments, we prefer to reduce the chance of this.

The asynchronous replication model might lose user-visible transactions during a unplanned failover. If the master crashes and we let a slave take over, then the application must be prepared to check which transactions actually made it to the slave, and rerun the ones that did not.

Overview

To solve the asynchronous problem, we can add different degrees of synchronicity: fully synchronous replication would wait for the slave to process the transaction first, before telling the client that it has been committed. The downside: delays in commits.

We propose to do semi-synchronous replication: before telling the client that a transaction has been committed, make sure that the slave receives its replication events first. This is also called 2-safe replication. Below is the picture of a semi-synchronous replication:


MySQL commit protocol

The commit protocol is different between MySQL-4.x and MySQL-5.0. The main reason is because MySQL-5.0 uses two phase commit to make sure binlog status conforms to transactional storage engines' internal status.
  • MySQL-4.x
    • write the transaction in the binlog file
    • commit the transaction in InnoDB or other storage engine
  • MySQL-5.0:
    • prepare the transaction in InnoDB or other storage engines
    • write the transaction in the binlog file - this is considered as the commit point
    • commit the transaction in InnoDB or other storage engines

Semi-synchronous commit protocol

Our proposed semi-synchronous replication works in the following way:
  • commit the transaction
  • wait for the replica databases acknowledge that they already received the transaction - this step has a timeout
  • tell the client that the commit has been processed

The committed transaction would not wait indefinitely for the replication thread to send the binlog event. If so, the transaction would never commit if there are network issues or the slave database is down. In step-2, the committed transaction will timeout after a predefined waiting time.

After the timeout, the semi-synchronous replication will be disabled. A new replication thread can catch up in replication and enables it again.

During the wait for network acknowledgment, other transaction would not be blocked and can still continue.

The following global counters will be added:
  • transaction failure timeouts
  • transactions without going through semi-synchronous replication
  • network timeouts

TCP/IP is not enough for acknowledgment

The tricky thing is that replication thread calls TCP/IP to send the replication events. Note that TCP/IP, even with the TCP_NODELAY option does not guarantee that the slave has received the data. Thus, to make sure that the slave database has got the transaction, the slave database must give us an reply to indicate that. This means a transaction commit requires at least a TCP round-trip time. Considering that the round-trip time in one data center is 0.5ms, this should not prevent MySQL from achieving above hundreds of transaction per second.

We will also provide the option of sending the transaction without waiting for the confirmation. We can measure the performance difference to understand the network overhead in the synchronous replication. A parameter will be provided to dynamically change the timeout.

Replication protocol changes

To guarantee that a slave database has got the transaction, the slave database must send one reply message back. This is the situation:
  • the master database need to know when to wait for the reply from the slave database; right now, the master database never waits
  • the slave database need to know when it should send reply message to the master master database
  • we can not do the ping-pong process for every replication event; it can only work for one transaction to minimize the network overhead

In this way, we must have a way for both the master and the slave know when to start this confirmation process. So, any design without replication event changes or replication protocol changes is not possible because the slave database can only figure out the information from the received message. Initially, we wanted to make the replication event change that one special event is appended after a transaction to indicate the slave waiting. However, since replication logs will be served at least once for each replica, this turns out to be a bad idea because we wait only once during transaction commit time.

The only solution after this is to make replication protocol changes. This is the current MySQL replication login process:
  • on the slave database side:
    • a slave database calls safe_connect() to login to the master database
    • COM_BINLOG_DUMP command is sent to the master database to request for binlogs with the following information: binlog_filename, binlog_pos, binlog_flag, server_id
  • on the master database side:
    • COM_BINLOG_DUMP is handled to recognize the requested dump information
    • mysql_binlog_send() is called to send the requested binlog events

Because binlog_flag is sent from the slave database and processed in the master database, semi-synchronous replication will be initiated by the slave and the replication thread will trigger the synchronous operation in the master database. We add one bit in binlog_flag so that the slave database can register itself as synchronous replication target.

    * #define BINLOG_SEMI_SYNC 0x02

If BINLOG_SEMI_SYNC is set for the replication thread, then every event sent from the master database to the slave database will always have one byte extra header. The one byte indicates whether the replication thread is expecting the reply from the slave database. In this way, the new replication protocol's usage is session-based.

Work on the master database side

We will create a search tree that records all waiting transactions. The tree will be keyed on (binlog_filename, binlog_pos). At transaction commit time, after all transaction events have been written into the binlog file, we insert the (binlog_filename, binlog_pos) into the search tree. The purpose of the search tree is for the replication thread to recognize the current waiting transactions. When a transaction stops waiting for the reacknowledgment of the binlog events, the transaction's position should be removed from the tree.

The replication thread reads a binlog event from the file and probe the binlog position into the search tree. Depending on whether the position in the search tree, the replication thread will set the one byte extra header before sending the event.

Work on the slave database side

If a slave database is connecting with the semi-synchronous replication mode, it will check the first byte header to decide whether to reply the replication event. Otherwise, it work as original.

Currently, the master database uses one mutex LOCK_log to synchronize all operations on the binlog:
  • a transaction acquires LOCK_log before writing transaction events to a binlog
  • the transaction releases LOCK_log after committing and flushing the binlog to the file system
  • replication thread acquires LOCK_log before reading each event and release the lock afterwards

In semi-synchronous replication, we are planning to add one mutex and one condition variable:
  • innobase_repl_semi_cond: this variable is signaled when enough binlog has been sent to slave, so that a waiting transaction can return the 'ok' message to the client for a commit
  • innobase_repl_semi_cond_mutex: the mutex that is associated with the above condition variable

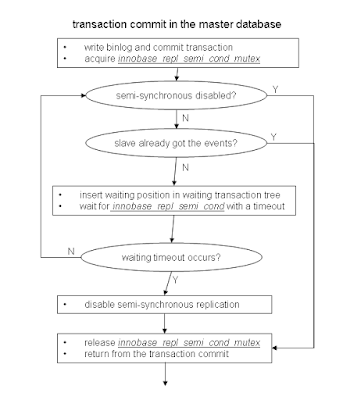
Code flow for each MySQL session during transaction commit
  • write all binlog events, append the transaction-end event and flush the file to the filesystem
  • commit the transaction inside InnoDB
  • acquire innobase_repl_semi_cond_mutex
  • while true:
    • if semi-synchronous replication has been disabled by timeout:
      • update the asynchronous transaction counter
      • release innobase_repl_semi_cond_mutex and return from the commit
    • check the current binlog sending status
    • if the binlog sending status is ahead of my transaction's waiting position
      • release innobase_repl_semi_cond_mutex and return from the commit
    • set my binlog waiting position to my commited transaction position
    • wait for innobase_repl_semi_cond with a timeout
    • if timeout occurs with waiting innobase_repl_semi_cond or if semi-synchronous replication is disabled after wake-up
      • print the error message
      • update failed timeout counter
      • disable the semi-synchronous replication until the replication thread enables it again
      • release innobase_repl_semi_cond_mutex and return from the commit


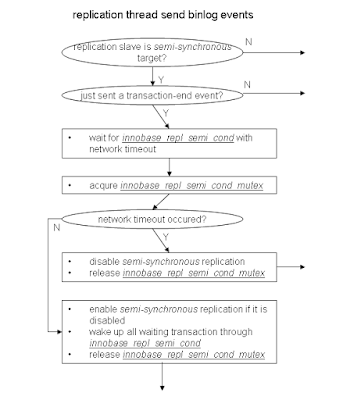
Code flow for replication thread

This is the work done by the replication thread when sending binlog events to support the semi-synchronous protocol.
  • if the replication is not the semi-synchronous target, then do nothing and simply return
  • if the most recent sent event is NOT an transaction-end event, then do nothing and simply return
  • wait for the confirmation from the slave database with a network timeout
  • remember whether network timeout occurs
  • acquire innobase_repl_semi_cond_mutex
  • if the network timeout occurs:
    • update failed timeout counter
    • disable the semi-synchronous replication until the replication thread enables it again
    • release innobase_repl_semi_cond_mutex and return
  • if the semi-synchronous replication is disabled, then enable the semi-synchronous replication again
  • check whether any session is waiting for the current sending position
  • if there exist such sessions, wake them up through innobase_repl_semi_cond
  • release innobase_repl_semi_cond_mutex and return

The only one mutex/condition variable create one synchronize point because every committed transaction needs to wait for innobase_repl_semi_cond. When the replication thread wakes up innobase_repl_semi_cond, it has to use broadcast. This might be changed in the future if there are performance issues around the single mutex wait.

Codeflow for replication I/O thread connection to the primary database

When a replica connects to the primary database, it is an opportunity for the primary database to understand the replica's progress. Based on the progress, the primary database will adjust semi-synchronous replication's progress. If the replica's status is too behind, semi-synchronous replication might be suspened until the replica is fully caught up.

If there is only one semi-synchronous target, meaning just one thread is sending the binlog to the slave for which we want synchronous replication, then the replication position should increase monotonically. However, we want to have more than one semi-synchronous replica target to increase the primary database's transaction availability. In that sense, a falling behind replica should not affect the status on the primary if others are caught up.

Network group commit

Replication threads can do group commit to minimize network overhead. When the thread finds the current sending event is a end of transaction event, it would request for a reply from the slave database immediately. Instead, it look for the tail of the binlog file to check whether there are more transaction. Or, it can wait for a while to make the check. If there are more transactions in the file, the replication thread can send all waiting transactions and only waits for one reply. This looks like that we are doing group commit on the network.

The benefit is that we can reduce network round trip by batching transaction replies. However, it also reduces the reliability of semi-synchronous replication. If we acknowledge each transaction, we can only lose at most one transaction during failure. If we do group commit, we might lose all transactions in the batch. We need to trade off between performance and reliability.

Historical - SemiSync replication

This post was shared on code.google.com many years ago but code.google has been shutdown. It describes work done by my team at Google. I am interested in the history of technology and with some spare time have been enable to republish it.

Semisync was useful to but misunderstood. Lossless semisync was awesome but perhaps arrived too late as Group Replication has a brighter future. I like Lossless semisync because it provides similar durability guarantees to GR without the overhead of running extra instances locally. Not running extra instances locally for GR means that commit will be slow courtesy of the speed of light. I hope that GR adds support for log-only voters (witnesses).

Regular semisync was misunderstood because people thought it provided extra durability. It didn't do that. It rate limited busy writers to reduce replication lag. It also limited a connection to at most one transaction that wasn't on at least one slave to reduce the amount of data that can be lost when a primary disappears.

Wei Li implemented semisync during his amazing year of work on replication. Then it was improved to lossless semisync by Zhou Zhenzing (see the first and second post and feature request) and work done upstream. Lossless semisync was widely deployed at FB courtesy of Yoshinori Matsunobu.

Introduction

Heikki Tuuri had the idea and perhaps a PoC but there wasn't much demand for it beyond me. Solid will offer their version of this later in 2007. We couldn't wait and implemented it.

The MySQL replication protocol is asynchronous. The master does not know when or whether a slave gets replication events. It is also efficient. A slave requests all replication events from an offset in a file. The master pushes events to the slave when they are ready.

Usage

We have extended the replication protocol to be semi-synchronous on demand. It is on demand because each slave registers as async or semi-sync. When semi-sync is enabled on the master, it blocks return from commit until either at least one semi-sync slave acknowledges receipt of all replication events for the transaction or until a configurable timeout expires.

Semi-synchronous replication is disabled when the timeout expires. It is automatically reenabled when slaves catch up on replication.

Configuration

The following parameters control this:
  • rpl_semi_sync_enabled configures a master to use semi-sync replication
  • rpl_semi_sync_slave_enabled configures a slave to use semi-sync replication. The IO thread must be restarted for this to take effect
  • rpl_semi_sync_timeout is the timeout in milliseconds for the master

Monitoring

The following variables are exported from SHOW STATUS:
  • Rpl_semi_sync_clients - number of semi-sync replication slaves
  • Rpl_semi_sync_status - whether semi-sync is currently ON/OFF
  • Rpl_semi_sync_slave_status - TBD
  • Rpl_semi_sync_yes_tx - how many transaction got semi-sync reply
  • Rpl_semi_sync_no_tx - how many transaction do not get semi-sync reply
  • Rpl_semi_sync_no_times - TBD
  • Rpl_semi_sync_timefunc_failures - how many gettimeofday() function fails
  • Rpl_semi_sync_wait_sessions - how many sessions are waiting for replies
  • Rpl_semi_sync_wait_pos_backtraverse - how many time we move waiting position back
  • Rpl_semi_sync_net_avg_wait_time(us) - the average network waiting time per tx
  • Rpl_semI_sync_net_wait_time - total time in us waiting for ACKs
  • Rpl_semi_sync_net_waits - how many times the replication thread waits on the network
  • Rpl_semi_sync_tx_avg_wait_time(us) - the average transaction waiting time
  • Rpl_semi_sync_tx_wait_time - TBD
  • Rpl_semi_sync_tx_waits - how many times transactions wait
  • Rpl_semi_sync_timefunc_failures - #times gettimeofday calls fail

Design Overview

Semi-sync replication blocks any COMMIT until at least one replica has acknowledged receipt of the replication events for the transaction. This ensures that at least one replica has all transactions from the master. The protocol blocks return from commit. That is, it blocks after commit is complete in InnoDB and before commit returns to the user.

This option must be enabled on a master and slaves that are close to the master. Only slaves that have this feature enabled participate in the protocol. Otherwise, slaves use the standard replication protocol.

Deployment

Semi-sync replication can be enabled/disabled on a master or slave without shutting down the database.

Semi-sync replication is enabled on demand. If there are no semi-sync replicas or they are all behind in replication, semi-sync replication will be disabled after the first transaction wait timeout. When the semi-sync replicas catch up, transaction commits will wait again if the feature is not disabled.

Implementation

The design doc is here.

Each replication event sent to a semi-sync slave has two extra bytes at the start that indicate whether the event requires acknowledgement. The bytes are stripped by the slave IO thread and the rest of the event is processed as normal. When acknowledgement is requested, the slave IO thread responds using the existing connection to the master. Acknowledgement is requested for events that indicate the end of a transaction, such as commit or an insert with autocommit enabled.