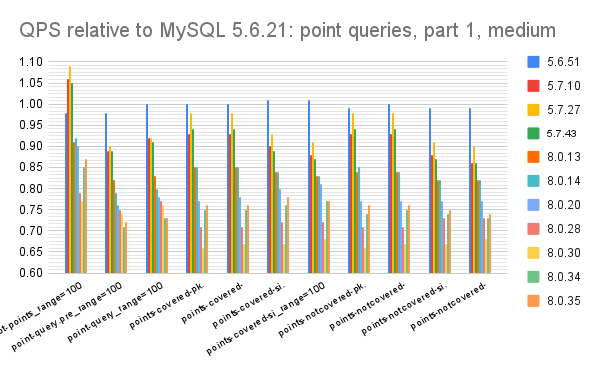
This post has results from sysbench for all releases of MySQL 8.0 and 5.7 along with some releases of 5.6. All tests used InnoDB. I previously shared results from a small server and here I share results for both the medium and small servers -- they are similar. The goal is to document where things get faster or slower over time for a medium-concurrency and CPU-bound workload. The focus is on CPU regressions.
Because I include graphs from the medium and small servers there are more graphs so I will split my report into several blog posts. This post has results comparing some releases from each of 5.6, 5.7 and 8.0.
tl;dr
- Results like this are motivation for using changepoint detection as part of the upstream dev cycle
- Bug 102037 was fixed in 8.0.31. This arrived in 8.0.22 and was reported by me with help from sysbench. With the fix, QPS is doubled for SELECT statements with large inlists. See the results below in Point queries, part 2
- MySQL 8.0 uses more CPU/operation than MySQL 5.6
- For point queries, MySQL 8.0 gets ~75% of the QPS vs MySQL 5.6
- For range queries without aggregation, MySQL 8.0 gets 60% to 70% of the QPS vs MySQL 5.6
- For range queries with aggregation, MySQL 8.0 and 5.6 get similar QPS. Perf for MySQL 5.7 is much better than 5.6, but with new CPU overheads in 8.0 that benefit is fading.
- For writes, MySQL 8.0 gets up to 4X more QPS than MySQL 5.6 but the perf improvements for writes. are degrading as new releases add new CPU overhead
- 5.6 - 5.6.21, 5.6.31, 5.6.41, 5.6.51
- 5.7 - all point releases from 5.7.10 to 5.7.43
- 8.0 - all point releases from 8.0.13 to 8.0.35
I used sysbench and my usage is explained here. Tests were run on a c2-standard-30 server from GCP with 15 cores, hyperthreads disabled, 120G RAM and 1.5T of local SSD via 4 NVMe devices with XFS and SW RAID 0. The test tables are cached by InnoDB.
All of the charts have relative throughput on the y-axis where that is (QPS for $me) / (QPS for $base), $me is a version (for example 5.7.24) and $base is the base version. The base version is the oldest version being compared and the goal is to see whether QPS is better or worse over time. The y-axis doesn't start at zero to improve readability.
- MySQL 8.0 gets ~75% of the throughput relative to MySQL 5.6
- Ignoring bug fixes, like the benefit from fixing bug 102037 in MySQL 8.0.31, the perf regressions are mostly slow and steady with new new release.
- MySQL 8.0 gets ~75% of the throughput relative to MySQL 5.6
- Ignoring bug fixes, like the benefit from fixing bug 102037 in MySQL 8.0.31, the perf regressions are mostly slow and steady with new new release.
Summary
- MySQL 8.0 gets 60% to 70% of the throughput relative to MySQL 5.6
- Perf regressions are mostly slow and steady with new new release
- MySQL 8.0 and 5.6 get similar throughput
- Perf regressions are mostly slow and steady with new new release. Perf for MySQL 5.7 is much better than 5.6 but that benefit is slowly fading in 8.0 because there is new CPU overhead.
- MySQL 8.0 gets up to 4X more QPS than MySQL 5.6
- Perf regressions are mostly slow and steady with new new release and the difference between modern MySQL and MySQL 5.6 is shrinking.


No comments:
Post a Comment