I used sysbench to search for performance regressions from old MySQL (5.6.51) to modern MySQL (8.0.32) with InnoDB and to determine the impact of compiler optimizations because I build it from source. The context for the results is short-running queries, in-memory (cached by InnoDB) with low-concurrency (1 & 4 clients) on a small server (8-core AMD).
tl;dr
- The best build used link time optimization, CMAKE_BUILD_TYPE=Release and -O3 (named rel_lto below). It gets ~5% more throughput than the base case.
- MySQL 8.0.32 gets <= 75% of the throughput versus 5.6.51 for short-running queries. The root cause is more CPU overhead per query and the problem has been there from 5.6 to 5.7 to 8.0.
Benchmark
A description of how I run sysbench is here. Tests use the Beelink server (8-core AMD, 16G RAM, NVMe SSD). The sysbench tests were run for 600 seconds per microbenchmark using 1 table with 20M rows. All tests use the InnoDB storage engine. The test database fits in the InnoDB buffer pool. The benchmark was repeated for 1 and 4 clients.
Builds
I tested MySQL versions 5.6.51, 5.7.40, 8.0.22, 8.0.28, 8.0.31 and 8.0.32 using multiple builds for each version. For each build+version the full set of sysbench microbenchmarks was repeated.
Compiler options tested by the builds include:
Compiler options tested by the builds include:
- -O2 vs -O3
- link time optimization via -flto
- CPU specific tuning via -march=native -mtune=native
- CMAKE_BUILD_TYPE set to RelWithDebInfo vs Release (see here)
The possible builds are:
- rel_withdbg
- CMAKE_BUILD_TYPE=RelWithDebInfo which implies -O2 -flto (this gets link time optimization by default, unlike Release)
- rel
- CMAKE_BUILD_TYPE=Release which implies -O3
- rel_o2
- CMAKE_BUILD_TYPE=Release, forces -O2
- rel_native
- CMAKE_BUILD_TYPE=Release which implies -O3, adds -march=native -mtune=native
- rel_o2_lto
- CMAKE_BUILD_TYPE=Release, forces -O2, adds -flto for link time optimization
- rel_native_lto
- CMAKE_BUILD_TYPE=Release which implies -O3, adds -march=native -mtune=native, adds -flto for link time optimization
- rel_lto
- CMAKE_BUILD_TYPE=Release which implies -O3, adds -flto for link time optimization
For MySQL 5.6.51 I tested these builds: rel, rel_o2, rel_native. The command line for cmake, output from cmake and output from make is here.
For MySQL 5.7.40, 8.0.22 and 8.0.28 I tested these builds: rel, rel_o2, rel_o2_lto, rel_native_lto, rel_lto. The command line for cmake, output from cmake and output from make is here for 5.7.40, 8.0.22 and 8.0.28.
For MySQL 8.0.31 and 8.0.32 I tested these builds: rel_withdbg, rel, rel_o2, rel_native, rel_o2_lto, rel_native_lto, rel_lto . The command line for cmake, output from cmake and output from make is here for 8.0.31 and 8.0.32.
Results: 1 thread, per-version
The result spreadsheets are here for 1-thread and for 4-threads. The results for 4-threads are similar to 1-thread so I don't explain them below but you can view them on the spreadsheet.
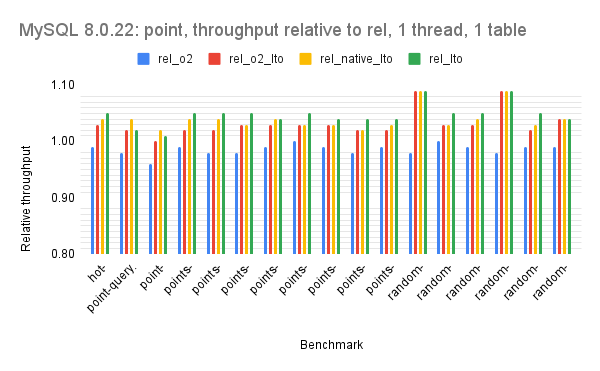
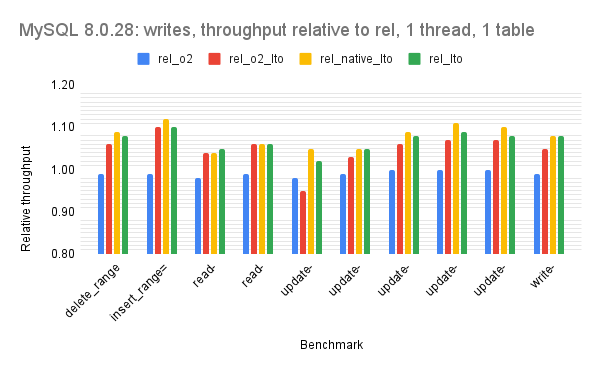
The graphs use relative throughput which is throughput for me / throughput for base case. When the relative throughput is > 1 then my results are better than the base case. When it is 1.10 then my results are ~10% better than the base case. For MySQL versions 5.6.51, 5.7.40, 8.0.22 and 8.0.28 the base case is the rel build. For MySQL 8.0.31 and 8.0.32 the base case is the rel_withdbg build.
There are three graphs per version which group the microbenchmarks by the dominant operation: one for point queries, one for range queries, one for writes.
Disclaimers:
- Readability is much better via the spreadsheet so I did not make the graphs x-large here.
- For most of the graphs the axis with values doesn't start at 0 to improve readability
For MySQL 5.6.51 the throughput median for rel_native relative to rel is 1.01 for point, 1.00 for range, 1.00 for writes.


For MySQL 5.7.40 the throughput median for rel_lto relative to rel is 1.03 for point, 1.06 for range, 1.07 for writes.


For MySQL 8.0.22 the throughput median for rel_lto relative to rel is 1.05 for point, 1.04 for range, 1.08 for writes.


For MySQL 8.0.28 the throughput median for rel_lto relative to rel is 1.05 for point, 1.04 for range, 1.08 for writes.


For MySQL 8.0.31 the throughput median for rel_lto relative to rel_withdbg is 1.05 for point, 1.03 for range, 1.03 for writes. The builds without link-time optimization (rel, rel_o2, rel_native) suffer relative to rel_withdbg because rel_withdbg uses link-time optimization.


For MySQL 8.0.32 the throughput median for rel_lto relative to rel_withdbg is 1.04 for point, 1.00 for range, 1.01 for writes. The builds without link-time optimization (rel, rel_o2, rel_native) suffer relative to rel_withdbg because rel_withdbg uses link-time optimization.


Results: 1 thread, all versions
These have results for all versions (5.6.51, 5.7.40, 8.0.22, 8.0.28, 8.0.31, 8.0.32) on one graph using the rel build for 5.6.51 and the rel_lto build for all other versions.
The result spreadsheets are here for 1-thread and for 4-threads. The results for 4-threads are similar to 1-thread.
The graphs use relative throughput which is throughput for me / throughput for base case. When the relative throughput is > 1 then my results are better than the base case. When it is 1.10 then my results are ~10% better than the base case. The base case is the rel build with MySQL 5.6.51.
There are regressions (more CPU/query) in each release since 5.6.51. There is much new CPU overhead. There are even significant regressions from 8.0.22 to 8.0.28 to 8.0.31 to 8.32. The median relative throughput for MySQL 8.0.32 versus 5.6.51 is <= 0.75 in all cases. That means that modern MySQL gets no more than 75% of the throughput (QPS) compared to old MySQL for short-running statements.
This table shows the median throughput for 8.0.32 relative to 5.6.51 for the 1-thread and 4-thread. benchmarks.
There are three graphs per version which group the microbenchmarks by the dominant operation: one for point queries, one for range queries, one for writes. The median relative throughput for 8.0.32 is less than 1.0 for all microbenchmarks which means it gets less QPS from all microbenchmarks relative to 5.6.51.


Results: 4 threads, all versions
The regressions for 8.0.32 with 4 threads are still significant but not as bad as with 1 thread. There are three microbenchmarks that get more throughput with 8.0.32 than 5.6.51: read-only.pre_range=10000, read-only_range=10000, update-index_range=100. The relative throughput for them is 1.05, 1.05 and 1.56.
- The read-only* microbenchmarks are the traditional sysbench workload (excluding writes) that do 10,000 row range queries (--range-size=10000) with aggregation. The Lua is here and the SQL is here.
- The update-index microbenchmark does updates that require index maintenance. Lua for update-index is here and the SQL is here. The my.cnf for 8.0 disables redo log threads as those make a small server unhappy (too much wasted CPU and would cause crashes in some of my tests in 8.0.2x).
These have results for all versions (5.6.51, 5.7.40, 8.0.22, 8.0.28, 8.0.31, 8.0.32) on one graph using the rel build for 5.6.51 and the rel_lto build for all other versions.
The result spreadsheets are here for 1-thread and for 4-threads.
The graphs use relative throughput which is throughput for me / throughput for base case. When the relative throughput is > 1 then my results are better than the base case. When it is 1.10 then my results are ~10% better than the base case. The base case is the rel build with MySQL 5.6.51.


Summary statistics: 1 thread, all versions
Summary statistics of the relative throughput values from the 1-thread benchmarks for versions 5.7.40, 8.0.22, 8.0.28, 8.0.31 and 8.0.32 (relative to 5.6.51) are below. These are grouped by workload type: point, range and writes. All use the results from the rel_lto build for versions after 5.6.51 and the rel build for 5.6.51.
Summary statistics: 4 threads, all versions
Summary statistics of the relative throughput values from the 4-threads benchmarks for versions 5.7.40, 8.0.22, 8.0.28, 8.0.31 and 8.0.32 (relative to 5.6.51) are below. These are grouped by workload type: point, range and writes. All use the results from the rel_lto build for versions after 5.6.51 and the rel build for 5.6.51.
-
No comments:
Post a Comment