I recently shared results for Postgres vs sysbench on a large server. The results were mostly boring (it is rare for me to spot regressions in Postgres) but there was one microbenchmark where there was a problem. The problem microbenchmark does a range scan with aggregation and the alleged regression arrived in Postgres 11. With advice from Postgres experts it looked like the problem was an intermittent change in the query plan.
In this post I explain additional tests that I did and in this case the alleged regression was still there, but like many things in DBMS-land it depends, there is nuance. For now I assume the problem is from a change in the query plan and I will run more tests with more instrumentation to investigate that. Here the alleged regression might be ~5% and only at the highest concurrency level (40. clients).
Postgres the DBMS and community are not fans of query plan hints and the sysbench tests that I use don't add hints for queries. Query plan hints are possible in Postgres via the pg_hint_plan extension. Query plan hints have been good to me with web-scale MySQL. For some of the web-scale workloads that I support the SQL and schema doesn't change much and query plan hints have two benefits -- plan stability and CPU reduction. By CPU reduction I mean that the CPU overhead from the optimizer is reduced because it has less work to do.
tl;dr
- There might be a regression for some range queries, but it is small here (~5%) and only occurs at the highest concurrency level (40 clients). I assume this is from a change in the query plan.
- I have yet to explain the alleged regression
- I like query plan hints
The problem microbenchmark
The microbenchmarks in question do a range scan with aggregation and have a name like read-only_range=$X where X has been 10, 100 and 1000. The value of X is the length of the range scan. These are run via oltp_read_only.lua and uses these SQL statements.
Build, configuration, hardware, benchmark
These are described in my previous post. But a few things have changed for this report
- I only tested Postgres versions 10.23, 11.0 and 11.10
- I repeated the benchmark for 1, 10, 20 and 40 client threads. Previously I only ran it for 40.
- I ran the read-only_range=$X microbenchmark for X in 10, 100, 1000, 2000, 4000, 8000, 16000 and 32000. Previously I ran it for X in 10, 100, 10000.
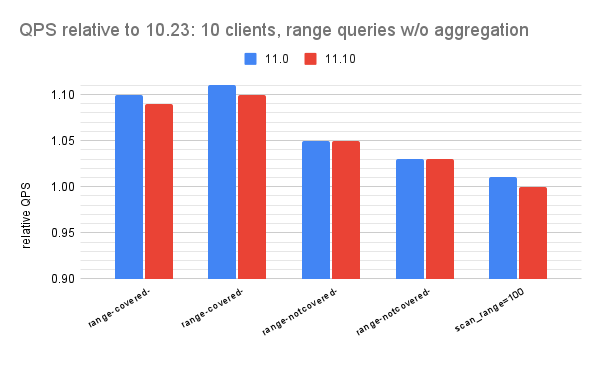
(QPS for $version) / (QPS for Postgres 10.23)
- the y-axis shows the relative QPS
- the y-axis starts at 0.90 to make it easier to see differences
- there are 4 charts per section, one for each of 1, 10, 20 and 40 clients
- Postgres 11.x is always faster than 10.23 and usually about 3% faster


- There are no regressions
- Postgres 11.0 & 11.10 get up to 11% more QPS than 10.23 for the range-covered and range-notcovered microbenchmarks
- For the scan microbenchmark QPS is mostly unchanged between Postgres 10.23, 11.0 and 11.10 but in one cases Postgres 11 was slightly slower (relative QPS for 11.0 was 0.99 at 20 clients).


Summary:
- In general, the advantage for Postgres 11.0 & 11.10 vs 10.23 was largest for the longest range scans (16000 & 32000) and next largest for the shortest range scans (10 & 100).
- The comparison for range scans of length 1000, 2000, 4000 and 8000 was interesting. Here the benefit for Postgres 11.0 & 11.10 was not as large and in one case (range=8000 at 40 clients) there was a small regression (~5%). Perhaps there is a change in the query plan.


- Postgres 11.0 & 11.10 were almost always faster than 10.23 and up to 1.75X faster
- In one case (update-one microbenchmark at 20 clients) Postgres 11.0 & 11.10 were ~5% slower than 10.23. And this is odd because 11.0 and 11.10 were ~1.7X faster at 40 clients on the same microbenchmark. I can only wave my hands for this one. But don't think this is a regression.
- The update-one microbenchmark is run by oltp_update_non_index.lua (the name means it updates non-indexed columns), the SQL for the update is here and the schema is here.
- From vmstat and iostat metrics for 20 clients and for 40 clients and looking at the CPU /operation (cpu/o) and context switches /operation (cs/o)
- For 20 clients these are slightly larger for 11.0 & 11.10 vs 10.23
- For 40 clients these are significantly small for 11.0 & 11.10 vs 10.23
- The microbenchmarks that aren't read-only are run for 600 seconds each and it is possible for performance variance to come from write debt (writeback, vacuum, etc) inherited from microbenchmarks that preceded update-one. The order in which the update microbenchmarks are run is here and is update-inlist, update-index, update-nonindex, update-one, update-zipf. From the dop=20 tab on the spreadsheet, throughput is 1.1X to 1.3X larger for the 3 update microbenchmarks that precede update-one so inherited write debt might explain this results.


No comments:
Post a Comment