Thursday, July 21, 2022

The impact of max_background_threads, part 2

This is a follow to the results I published for the impact of max_background_jobs on RocksDB performance. The previous post used an IO-bound workload. This post uses a cached workload. The purpose for this work is to evaluate my rule of thumb that the number of busy threads should be <= the number of CPU cores. This is explained in detail in the previous post.

tl;dr

  • Similar to the results for IO-bound, while throughput increases with concurrency, so does variance so my rule of thumb still holds (keep the number of busy threads <= the number of cores).

Details

In this post I use jobs=X to indicate the value for max_background_jobs. Tests were run for jobs=8 and jobs=16. Command lines are here for a run that uses max_background_jobs=8 and 8 client threads. The IO-bound test used a database with 4B key-value pairs. This test uses 40M key-value pairs so the database fits in the RocksDB block cache. See the previous post for more details.

Results: throughput

The benchmark summaries are here for 1, 8, 16, 24, 32, 40, 48, 56, 64, 72 and 80 client threads.

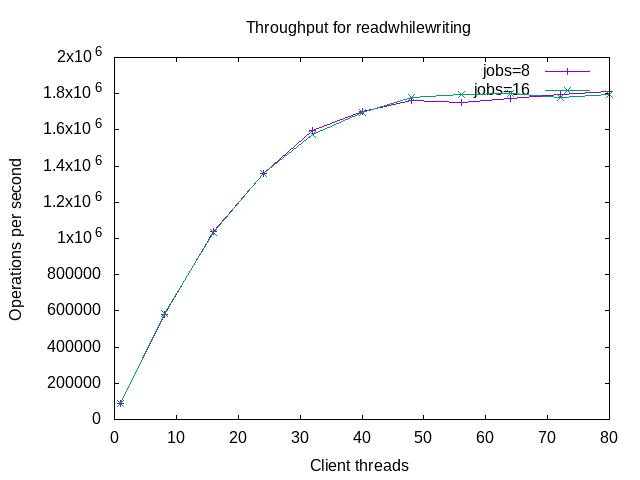
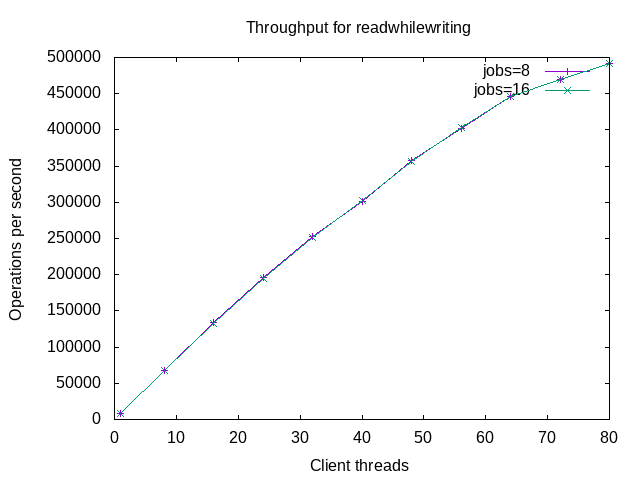
For all of the throughput graphs below except overwrite, the improvement with concurrency after 32 client threads isn't as good compared to the IO-bound results in the previous post. This is expected because the results here are for a CPU-bound workload, the server has 40 CPUs with 80 HW threads, and hyperthreading doesn't double compute capacity. The overwrite case is special because 1 client thread is sufficient to saturate throughput and beyond that the extra client threads just interfere with compaction threads.

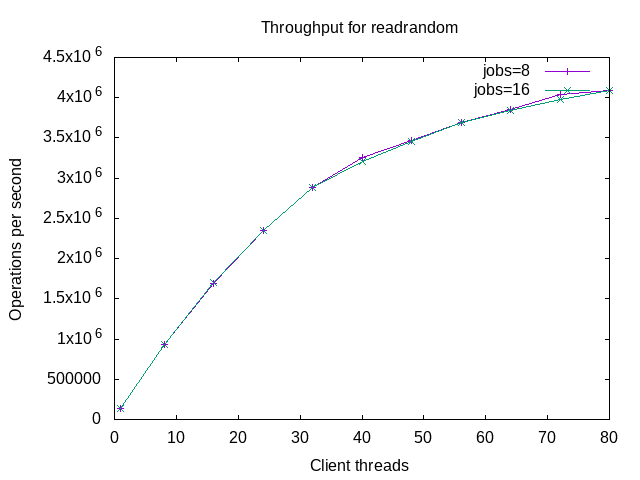
Graphs for throughput are next. The first graph is for readrandom. I don't share the graph for fillseq because the benchmark step finishes in less than 1 minute. Throughput improves with concurrency but the improvement degrades with more concurrency.


The graph for fwdrangewhilewriting is similar to readrandom.


The graph for readwhilewriting is similar to readrandom.


The graph for overwrite shows that 1 client thread is sufficient to saturate throughput. That isn't a surprise because fsync isn't enabled and writes are just inserts into an in-memory table. The average throughput is usually, but not always, better for jobs=16 than jobs=8.


Results: p99.99 response time


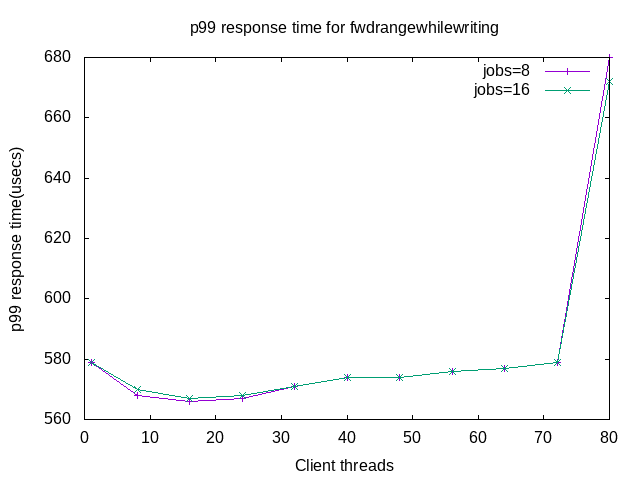
The p99.99 response time graphs are similar. Performance degrades once the CPU becomes saturated around 40 client threads. The first graph is for readrandom.


The next graph is for fwdrangewhilewriting.


The next graph is for read while writing. The curve here is straighter than the curve above for fwdrangewhilewriting. I have yet to explain that.


And the final graph is for overwrite. There is an interesting artifact between 64 and 80 client threads. I have yet to explain that.


Results: throughput vs time

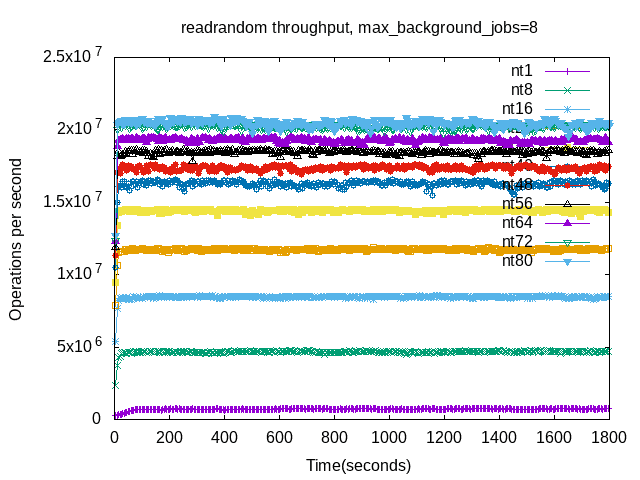
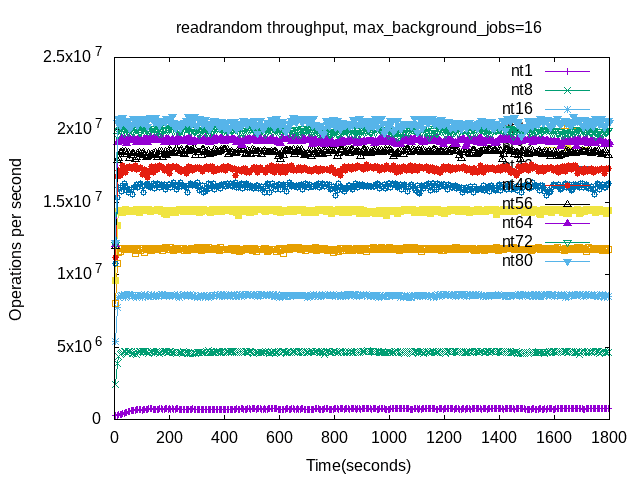
The next graphs display throughput per 5-second interval. There are two graphs per benchmark step -- one for jobs=8 and another for jobs=16.

The readrandom results aren't a surprise. Throughput increases with concurrency as does variance - compare the results for 1 client thread (nt1) with 80 client threads (nt80).


The graphs for fwdrangewhilewriting have more variance with increase concurrency compared to readrandom. This is expected for two reasons. First, there is less CPU because client threads compete with compaction threads for CPU. Second, there is more mutex contention and can be more write stalls. In this case there weren't any write stalls but mutex contention is harder to measure. Also note that throughput doesn't improve much beyond 32 client threads. This is also OK.


Results for readwhilewriting are similar to fwdrangewhilewriting in that beyond 32 client threads there is more variance and not much improvement in throughput. This lack of improvement is OK but I hope we can reduce the variance. However there are differences. There is less variance in general here than for fwdrangewhilewriting. My theory is that the range queries in fwdrangewhilewriting are more sensitive to the shape of the LSM tree. The point queries benefit from bloom filters. The range queries do not and there is periodic behavior as new SSTs are added to the L0, then compacted, repeat.


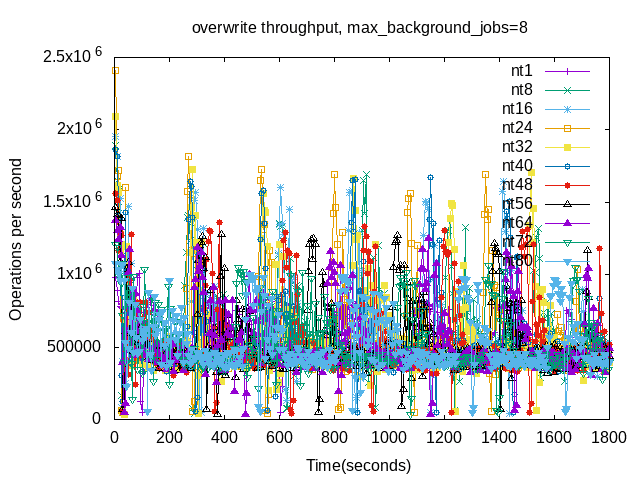
The overwrite graphs show the most variance to the point that they are hard to read. Keep on reading and there will be other graphs. Note that 1 client thread is sufficient to saturate throughput for overwrite and extra threads just compete for the CPU with compaction threads and increase variance.


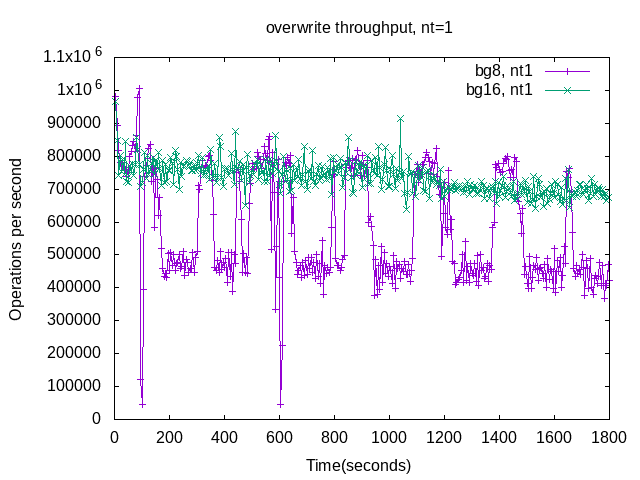
The results for overwrite have much variance even at 1 client thread. The results for jobs=8 and jobs=16 are similar. The worst-case write stalls are less than 0.5 seconds.


The results for overwrite with 8 client threads have a different pattern than 1 client thread, but still much variance.


The last pair of graphs is for overwrite with 32 client threads. The results are similar to the graphs above for 8 client threads.


Results: overwrite

This section has a few more graphs for overwrite.

The p50 response times are similar for jobs=8 and jobs=16.

The p99 response times are similar for jobs=8 and jobs=16.


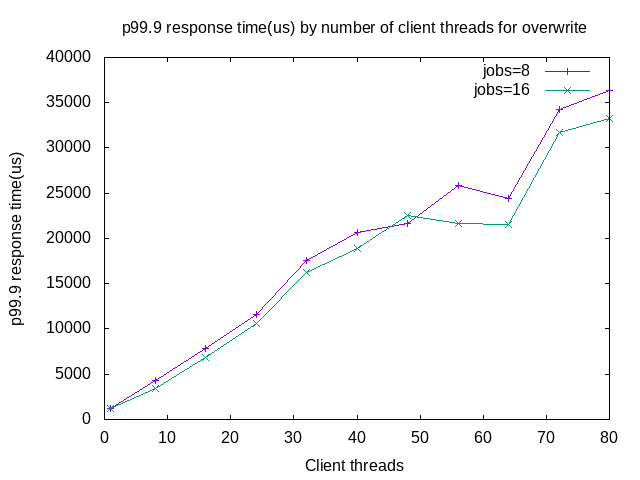
The p99.9 response times are similar for jobs=8 and jobs=16.


The p99.99 response times are similar for jobs=8 and jobs=16.


The max response times are similar for jobs=8 and jobs=16, but less so than the graphs above.


The graphs for write stall% are similar for jobs=8 vs jobs=16 but not similar to the graphs above. The best (lowest) case occurs for 1 client thread. The worst is for ~32 client threads. I don't know why it drops from there.


Wednesday, July 20, 2022

The impact of max_background_jobs on write throughput for RocksDB

I rely on rules of thumb when configuring a DBMS for a benchmark. This post is about configuring the number of background threads and the number of client threads for RocksDB to improve throughput and quality of service (low variance) with IO-bound workloads. The background threads are used for compaction and memtable flushes. The option is max_background_jobs. 

Eventually I need to evaluate or re-evaluate whether these rules of thumb are valid and I am doing that here. One rule I use is that the number of busy threads should be less than or equal to the number of CPU cores (real cores, not HW threads courtesy of hyperthreading) and the reason for that rule is to reduce variance for workloads that are either CPU-bound or write-heavy (write-heavy implies much CPU from compaction). I frequently run benchmarks to look for performance regressions and variance makes that search harder. By busy threads I mean #client-threads + #background-threads where #client-threads is the number of client threads used by the benchmark client and #background-threads is the value for max_background_jobs.

For this blog post I compare the performance between two RocksDB configurations that are identical with one exception. One uses max_background_jobs=8 and the other uses =16.

The tl;dr context is an IO-bound workload (many storage reads and writes) on a server with fast storage and 80 HW threads (40 cores, hyperthreading enabled).

tl;dr

  • Throughput improves with concurrency for up to 80 client threads for IO-bound workloads that are read-only or read-mostly. This comes at a reasonable increase in response time, usually <= 1.5x although fwdrangewhilewriting stops improving at 72 client threads.
  • Throughput for overwrite (write-only) degrades with concurrency. The peak is at <= 16 client threads. This isn't a surprise, as there is no fsync on write and the additional client threads just compete with compaction threads for CPU although the interference is interesting (keep on reading).
  • Throughput for overwrite is ~1.4X better with max_background_jobs=16 vs =8 on average. But the cost of better average throughput is more variance.
For now I will stick with jobs=8 when doing benchmarks on this hardware to get better quality of service but less throughput for overwrite.

Details

Something I learned recently is that the number of flush threads is max_background_jobs/4 and the number of compaction threads is max_background_jobs minus the number of flush threads. The code is here.

I used benchmark.sh, a server with 80 HW threads (hyperthreading enabled) and fast storage. The workload was IO-bound -- 4B KV pairs, ~1TB database and a low cache hit rate. The benchmarks were run for 1, 8, 16, 24, 32, 40, 48, 56, 64, 72 and 80 client threads using two configurations that only differed in the configuration value for max_background jobs -- 8 vs 16. Note that fillseq always uses 1 client thread.

I used a recent build of db_bench at git hash 7e2004a123. This has code that will become the 7.5 release. It includes two changes that greatly reduce the worst-case write stall (6115254 and b397dcd) but that is a topic for another post.

The sequence of benchmark steps is determined by benchmark_compare.sh and the interesting steps were: fillseq, readrandom, multireadrandom, fwdrangewhilewriting, readwhilewriting and overwrite. The *whilewriting steps used a 2MB/s rate limit on the background writer and were not write heavy. The fillseq step is write heavy but doesn't require compaction because inserts are in key order and the push down optimization is used. The final step, overwrite, is write heavy. Command lines are here for a run with 8 client threads and max_background_jobs=8.

I neglected to use --multiread_batched=true with the multireadrandom benchmark step so the results are mostly a duplicate of readrandom.

The benchmark summaries are here for 1, 8, 16, 24, 32, 40, 48, 56, 64, 72 and 80 client threads.

These benchmarks might suffer from coordinated omission because a fixed number of client threads is used. These results might also overstate the benefit of more throughput from more concurrency because the benchmark client doesn't enforce a response time SLA.

Results: throughput

The throughput graphs have results for 1, 8, 16, 24, 32, 40, 48, 56, 64, 72 and 80 client threads.

I used gnuplot for the graphs and did not set the y-range to zero. This was done to make it easier to see the differences but can mislead a drive-by reader. I also use jobs= rather than max_background_jobs= to save on typing. I also used lines rather than bars. Next time I might use bars.

Throughput for fillseq was slightly better with jobs=8 than =16. The difference is small and I won't try to explain it. The fillseq benchmark step does inserts in key order and always uses 1 client thread.

Throughput for readrandom improves with concurrency up to 80 client threads but the improvement degrades and USL might explain that. There is no difference between jobs=8 and =16. That is expected because this is read-only.

The results for fwdrangewhilewriting are similar to readrandom. There is no difference between jobs=8 and =16. That is probably because the write rate is low (2MB/s).

The results for readwhilewriting are similar to readrandom.

The throughput for overwrite is ~1.4X better for jobs=16 than =8. I didn't expect this but it is not a huge surprise. Write amplification during this test is ~17. Compaction IO statistics from the test end are here. The LSM tree has data in 8 levels so this is one example where the write-amp estimate of per-level fanout X number-of-levels is pessimistic.


Results: p99 response time

These graphs show the p99 response time in microseconds.

The results for readrandom and multireadrandom are interesting but I won't try to explain them.

The p99 response time for fwdrangewhilewriting shows that saturation happens after 72 client threads. That it happens at some point is expected.

The p99 response time for readwhilewriting doesn't show the saturation that is visible above for fwdrangewhilewriting.

The p99 response time for overwrite is the most interesting. Above it was shown that throughput for jobs=16 was ~1.4X better than for =8. But here the p99 response times are similar. While I haven't displayed it, the p50 response times are also similar. This will be explained below.

Throughput vs time

Next up is graphs for throughput vs time at 5-second intervals and I just wrote a note to myself change this to 1-second intervals for future tests. For each benchmark step there are two graphs, one for jobs=8 and another for jobs=16, with 11 lines per graph. There is one line for each number of threads, from 1 to 80 and they are labeled as nt$X on the graph where $X is the number of threads.

The results for fillseq show more variance at first glance for jobs=8 but that might be an illusion because the max for the y-range is larger for jobs=16. The throughput range in both cases is between ~100k/second and ~300k/second after 2000 seconds.


For readrandom the variance increases with the number of client threads. The result for 80 client threads (nt80) has the most jitter. Results for multireadrandom are similar and I won't show them here.

Results for fwdrangewhilewriting show increasing variance as the number of client threads increases.


Results for readwhilewriting show increasing variance as the number of client threads increases.

The overwrite benchmark step has the most interesting graphs although it can be hard to see that here given there are 11 lines per graph. That will be fixed below if you keep on reading. Important points are:

  1. The worst-case write stall (minutes long) doesn't occur because it was recently fixed. I will explain more about that soon in another blog post.
  2. The result for jobs=8 shows a regular pattern of a peak then a gradual decline.
  3. The result for jobs=16 has more variance.
Which do you prefer -- better average throughput or less variance? Obviously, both is my answer.


The graphs above for overwrite are busy so I also have graphs limited to a specific number of client threads -- 1, 8 and 32. The problem with variance for jobs=16 doesn't occur at 1 client thread (nt1) but does occur at 8 or more client threads. I hope to explain this one day. For now I will wave my hands and claim that the additional client threads interfere with the compaction threads -- for mutexes and CPU time.


Overwrite: the mystery about p50 and p99

Above I showed that overwrite has similar p99 response times for jobs=8 and jobs=16 but average throughput is ~1.4X better for jobs=16. I didn't show it but the p50 response times are also similar. But in the p99.9 and p99.99 results (no graphs but read the summaries linked above) the values are worse for jobs=16.

The problem is that outliers are worse for jobs=8 and one way to view that is via the response time histrograms printed at the end of the benchmark step. They are here for the nt1 (1 client thread) test. With jobs=16, 99.278% of responses take <= 10 usecs vs (see here and here).

While they are listed in the summaries linked above I don't have graphs for the write stall% from overwrite as this post is already too long. But from the linked summaries at 1 client thread the write stall% is 24.6 for jobs=8 vs 0% for jobs=16. At 8 client threads it is 54.2% for jobs=8 vs 33.1% for jobs=16.

Tuesday, June 28, 2022

Setting up a server on GCP

 This is mostly a note to myself to explain what I do to setup a server on GCP for database benchmarks.

Create the instance

  1. Confirm that quota limits have not been reached on the Quotas page.
  2. Go to the VM instances page and click on Create Instance
  3. Edit the instance name
  4. Edit the region (us-west1 for me)
  5. Choose the instance type. Click on Compute Optimized, select the c2 series, select the Machine Type and then c2-standard-60.
  6. Disable hyperthreading to reduce benchmark variance. Click on CPU Platform and GPU, click on vCPUs to core ratio and choose 1 vCPU per core.
  7. Scroll down to Boot disk and click on Change. Click on Operating System and select Ubuntu. Click on Version and select Ubuntu 22.04 LTS. Don't change Boot disk type (the default is Balanced persistent disk). Change Size (GB) to 100. Then click on Select.
  8. Scroll down to Identity and API access and select Allow full access to all Cloud APIs. This enables read and write access to Cloud Object Storage buckets where I upload benchmark results and download binaries and other test files. If you forget to do this, you can stop the server, change the setting and continue.
  9. Scroll down to Networking, Disks and ... then click on Disks, then click on Add New Disks. Change the disk name (I use $instance-name + "db"). Change Disk type to SSD Persistent Disk. Change the Size. I use 1000 GB for cached workloads and 3000 GB for IO-bound workloads. Then scroll down and for Deletion rule select Delete disk. If you forget to do this then you will continue to rent the storage after deleting the VM and can visit here to delete it.
  10. Scroll down and click on Create. At this point you will return to the VM Instances page while the instance is started.
Prepare the instance
  1. From the VM Instances page find the entry for the instance and click on the arrow under the Connect column for that instance. Select View gcloud command and copy the command line. This assumes you install the GCloud SDK on your laptop.
  2. Clone the RocksDB repo (optional): git clone https://github.com/facebook/rocksdb.git
  3. Install Ubuntu updates, then install packages. Some of the packages are only there in case I want to build RocksDB
    • sudo apt-get update; sudo apt-get upgrade
    • sudo apt install -y numactl fio sysstat
    • sudo apt install -y libgflags-dev libsnappy-dev zlib1g-dev liblz4-dev libzstd-dev
    • sudo apt install -y gcc g++ default-jdk make libjemalloc-dev
  4. Setup the filesystem for the cloud block storage
    • sudo mkfs.xfs /dev/sdb; sudo mkdir /data; sudo mount -o discard,defaults /dev/sdb /data ; sudo chown mcallaghan /data ; df -h | grep data ; mkdir -p /data/m/rx
    • I am mcallaghan, you might not be and that should be edited
    • I use /data/m/rx as the database directory
    • If you reboot the host, then you must do: sudo mount -o discard,defaults /dev/sdb /data
  5. sudo reboot now -- in case a new kernel arrived
  6. Things to do after each reboot:
    • sudo mount -o discard,defaults /dev/sdb /data
    • ulimit -n 70000 -- I have wasted many hours forgetting to do this. RocksDB likes to have far more than 1024 file descriptors open and 1024 is the default. 
    • screen -S me -- or use tmux. This is useful for long running benchmark commands
    • The default behavior for systemd is to remove your files from /dev/shm when you logout, even if a screen session is still running as you -- see here. This removes files that Postgres needs. To avoid that:
      1. add RemoveIPC=no to /etc/systemd/logind.conf
      2. sudo systemctl restart systemd-logind.service
  7. Run your benchmarks
    • I usually archive the db_bench binaries into an object storage bucket, so I copy that bucket onto the host
    • Since the RocksDB repo was clone above I can cd to $rocksdb_root/tools to find tools/benchmark_compare.sh and tools/benchmark.sh
Try fio

I am trying this out as my first step, characterize IO read performance with fio:
sudo fio --filename=/dev/sdb --direct=1 --rw=randread \
    --bs=4k --ioengine=libaio --iodepth=256 --runtime=300 \
    --numjobs=8 --time_based --group_reporting \
    --name=iops-test-job --eta-newline=1 --eta-interval=1 \
    --readonly --eta=always >& o.fio.randread.4k.8t

sudo fio --filename=/dev/sdb --direct=1 --rw=randread \
    --bs=1m --ioengine=libaio --iodepth=1 --runtime=300 \
    --numjobs=8 --time_based --group_reporting \
    --name=iops-test-job --eta-newline=1 --eta-interval=1 \
    --readonly --eta=always >& o.fio.randread.1m.8t

For both instances (1000G or 3000G of block storage) I get ~30k IOPs with 4k reads. For the 1M reads I get ~480M/s with 1000G of storage and ~12G/s with 3000G of storage.

Friday, June 24, 2022

Fixing mmap performance for RocksDB

RocksDB inherited support for mmap from LevelDB. Performance was worse than expected because filesystem readahead fetched more data than needed as I explained in a previous post. I am not a fan of the standard workaround which is to tune kernel settings to reduce readahead because that has an impact for everything running on that server. The DBMS knows more about the IO patterns and can use madvise to provide hints to the OS, just as RocksDB uses fadvise for POSIX IO.

Good news, issue 9931 has been fixed and the results are impressive. 

Benchmark

I used db_bench with an IO-bound workload - the same as was used for my previous post. Two binaries were tested:

  • old - this binary was compiled at git hash ce419c0f and does not have the fix for issue 9931
  • fix - this binary was compiled at git hash 69a32ee and has the fix for issue 9931.
Note that git hash ce419c0f and 69a32ee are adjacent in the commit log.

The verify_checksums option was false for all tests. The CPU overhead would be much larger were it true because checksum verification would be done on each block access. Tests were repeated with cache_index_and_filter_blocks set to true and false. That didn't have a big impact on results.

Results

The graphs have results for these binary+config pairs:

  • cache0.old - cache_index_and_filter_blocks=false, does not have fix for issue 9931
  • cache0.fix - cache_index_and_filter_blocks=false, has fix for issue 9931
  • cache1.old - cache_index_and_filter_blocks=true, does not have fix for issue 9931
  • cache1.fix - cache_index_and_filter_blocks=true, has fix for issue 9931
The improvements from the fix are impressive for benchmark steps that do reads for user queries -- see the green and red bars. The average value for the average read request size (rareq-sz in iostat) is:
  • for readwhilewriting: 115kb without the fix, 4kb with the fix
  • for fwdrangewhilewriting: 79kb without the fix, 4kb with the fix

Tell me how you really feel about mmap + DBMS

It hasn't been great for me. Long ago I did some perf work with an mmap DBMS and Linux 2.6 kernels suffered from severe mutex contention in VM code. Performance was lousy back then. But I didn't write this to condemn mmap and IO-bound workloads where the read working set is much larger than memory might not be the best choice for mmap.

For the results above if you compare the improved mmap numbers with the POSIX/buffered IO numbers in my previous post -- peak QPS for the IO-bound tests (everything but fillseq and overwrite) is ~100k/second with mmap vs ~250k/second with buffered IO.

From the vmstat results collected during the benchmark I see:
  • more mutex contention with mmap based on the cs column
  • more CPU overhead with mmap based on the us and sy columns

Legend:
* qps - throughput from the benchmark
* cs - context switches from the cs column in vmstat
* us - user CPU from the us column in vmstat
* sy - system CPU from the sy column in vmstat

Average values
IO      qps     cs      us      sy
mmap     91757  475279  15.0    7.0
bufio   248543  572470  13.8    7.0

Values per query (column divided by QPS, for us and sy result is multiplied by 1000)
IO      qps     cs      us      sy
mmap    1       5.2     163     76
bufio   1       2.3      55     28

Thursday, June 16, 2022

Insert Benchmark for Postgres 12, 13, 14 and 15: part 2

This has graphs of throughput vs time for three of the Insert Benchmark steps. The goal is to determine whether there is too much variance. A common source of variance is checkpoint stalls when using a B-Tree. This is a follow up to my blog post on the Insert Benchmark for Postgres versions 12.11, 13.7, 14.3 and 15b1. 

The benchmark steps for which graphs are provided are:

  • l.i0 - load in PK order without secondary indexes
  • l.i1 - load in PK order with 3 secondary indexes
The benchmark is repeated for two workloads -- cached and IO-bound. 

Cached

The database fits in memory for the cached workload.

There isn't much variance for the l.i0 workload.
The graph for the l.i1 workload is more exciting which is expected. For the l.i0 workload the inserts are in PK order and there are no secondary indexes. So each insert makes R/P pages dirty where R is the row size, P is the page size and R/P is much less than 1. But for l.i1 each insert is likely to make (3 + R/P) pages dirty so there is much more stress on page writeback and storage. The "3" in the estimate is from doing secondary index maintenance for each of the 3 secondary indexes. The drops in the graph are usually stalls when writeback falls behind.

IO-bound

The database is much larger than memory for the IO-bound workload.

The graph for l.i0 shows occasional drops that I assume are from writeback falling behind. However they can also be from the SSD that I use.

The graph for l.i1 is more interesting which is expected because it does more IO to storage per insert. The pattern is very regular and the insert rate gradually rises from ~2000/s to ~2800/s and this repeats every ~300 seconds. Were I to bet, this is caused by Postgres rather than my SSD. Perhaps one day I will do experiments to determine whether tuning the Postgres config can reduce the variance.


Insert Benchmark for Postgres 12, 13, 14 and 15

I ran the Insert Benchmark for Postgres versions 12.11, 13.7, 14.3 and 15b1. Reports are provided for cached and IO-bound workloads. The benchmark is run on Intel NUC servers at low concurrency. The goal is to determine how performance changes over time. A description of the Insert Benchmark is here.

tl;dr

  • I am not a Postgres expert
  • regressions are small in most cases
  • the l.i0 benchmark step has regressions that are worth investigating in versions 14 and 15b1
    • these regressions might have been fixed, see the perf report for the patch (15b1p1)
Updates:
  • regressions have been fixed, scroll to the end
  • added links to the configuration files
  • part 2 with throughput vs time graphs is here
  • provided data on the percentage of time in parse, analyze, optimize, execute
  • added command lines 
  • added the index + relation sizes after each test step
  • added links to performance reports when prepared statements were used for queries
  • added links to performance reports with a patch to improve version 15b1
  • added a second set of results for 15b1p1 (15b1 with the patch) for cached and IO-bound. Results are similar to the first set.
  • livestreaming my debugging efforts, see Debugging the regression below
  • added data from pg_stat_wal to the final section
  • added results for 15b2 for cached and IO-bound
The regression

After I shared this blog post a possible cause for the regression was discussed here and the community quickly provided a patch for me to test. The results are excellent as 15b1p1 (15b1 with the patch) almost matches the results for version 13.7 on the cached workload. For the IO-bound workload the patch fixes the regression for all but one of the benchmark steps (l.i1).

The improvement is obvious in the cached workload Summary. The improvement is also there for the IO-bound workload, but less obvious. In the IO-bound workload Summary the throughput for l.i0 (load without secondary indexes) and q100.1 are better than results for version 14.3 and almost match version 13.7. While the throughput for l.i1 (inserts with secondary index maintenance) did not improve. From the IO-bound metrics for l.i1 I see that CPU (cpupq == CPU per statement) has been reducing with each major release, but with the patch (15b1p1) the value increased to match the value for version 13.7. I don't see this effect in the l.i1 metrics with the cached workload.

Summer has arrived and thermal throttling might be an issue for my SSDs which would be an unfortunate source of variance. The next step is to repeat the IO-bound workload at night when it is cooler and then look at CPU profiles for l.i1.

A guide to the performance reports is here. For explaining performance the most interesting metric is cpupq (CPU/query or CPU/insert depending on the benchmark step). From the guide, cpupq includes CPU by the client, DBMS and anything else running on the server. The benchmark client, written in Python, uses a lot of CPU. That can make it harder to see how CPU changes from the DBMS. With MySQL, I can also measure the CPU time used by mysqld. With Postgres I am still figuring out how to provide a DBMS-only measurement of the CPU overheads.

Test setup

Tests are run on Intel NUC servers I have at home. The OS is Ubuntu 20.04, hyperthreading and turbo-boost are disabled. All binaries are compiled using the same gcc/glibc toolchain and all tests used the same server.

The benchmark is repeated for a cached and IO-bound workload. The database fits in memory for the cached workload and is larger than memory for the IO-bound workload. The Postgres configuration files are here for 12.11, 13.7, 14.3 and 15b1.

The Insert Benchmark description has more details. In summary the benchmark has several steps and I focus on the ones where performance changes:

  • l.i0 - load in PK order, the table that has no secondary indexes
  • l.x - create three secondary indexes
  • l.i1 - insert in PK order, the table that has 3 secondary indexes
  • q100.1 - measure range query QPS from one client while another does 100 inserts/s
  • q500.1 - measure range query QPS from one client while another does 500 inserts/s
  • q1000.1 - measure range query QPS from one client while another does 1000 inserts/s
The l.i0 step inserts 20m (500m) rows for the cached (IO-bound) workload. The l.i1 step inserts 20m (10m) rows for the cached (IO-bound) workload. The q100.1, q500.1 and q1000.1 steps each run for 2 hours.

Command lines to try out the insert benchmark:
# old school, no prepared statements
python3 iibench.py --db_user=foo --db_host=127.0.0.1 \
  --db_password=bar --dbms=postgres --db_name=ib --setup \
  --query_threads=1 --max_rows=1000000 --secs_per_report=1

# try out the new support for prepared statements
python3 iibench.py --db_user=foo --db_host=127.0.0.1 \
  --db_password=bar --dbms=postgres --db_name=ib --setup \
  --query_threads=1 --max_rows=1000000 --secs_per_report=1 \
  --use_prepared_insert --use_prepared_query

Cached workload

The reports are here for ibench without and with prepared statements used for queries. Next is a report for prepared statements and a patch for 15b1 (I call it 15b1p1) that fixes a CPU regression. Postgres query throughput improves by ~1.5X when prepared statements are used for queries. Prepared statements are not yet used for inserts because I need to debug CPU perf issues on the ibench client.

I use relative throughput to document performance changes. It is: my_throughput / base_throughput where base_throughput is the result from Postgres 13.7. The interesting changes are below. The results aren't surprising. In most cases the regressions are small because Postgres is good at avoiding them. The regressions for 15b1 are larger because it is a beta and a newer release.

Throughput relative to 13.7
version l.i0    l.i1    q100.1
14.3    0.934   0.971   0.971
15b1    0.856   0.946   0.953

The percentage of samples from pg_plan_queries, pg_parse_query, pg_analyze_and_rewrite and query execution from v14.3. Prepared statements were not used.

step    plan    parse   analyze execute
l.i0    20      11      25      44
l.i1    8       5       10      77
q100.1  33      6       10      51

Cached - l.i0

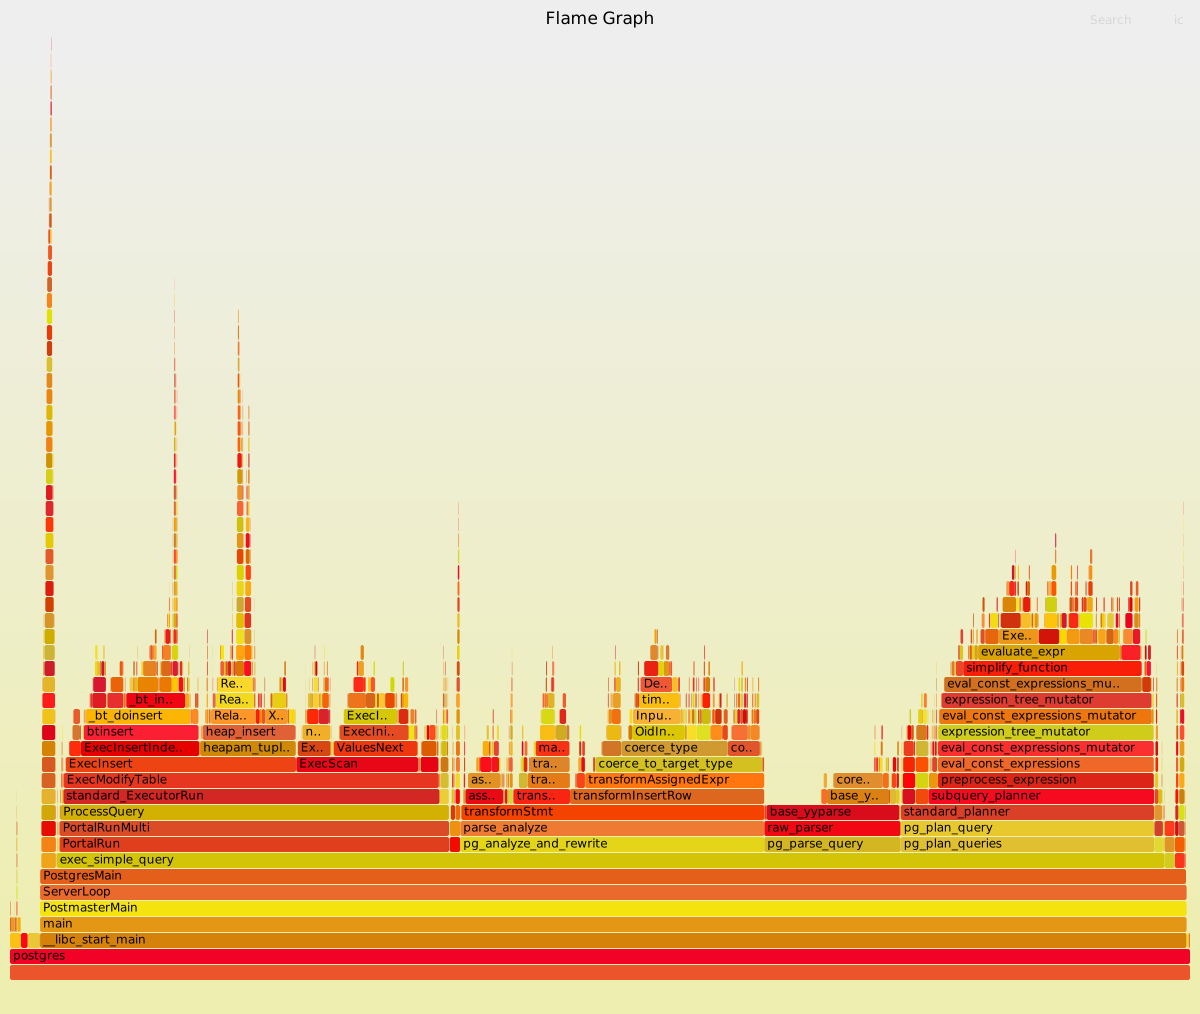
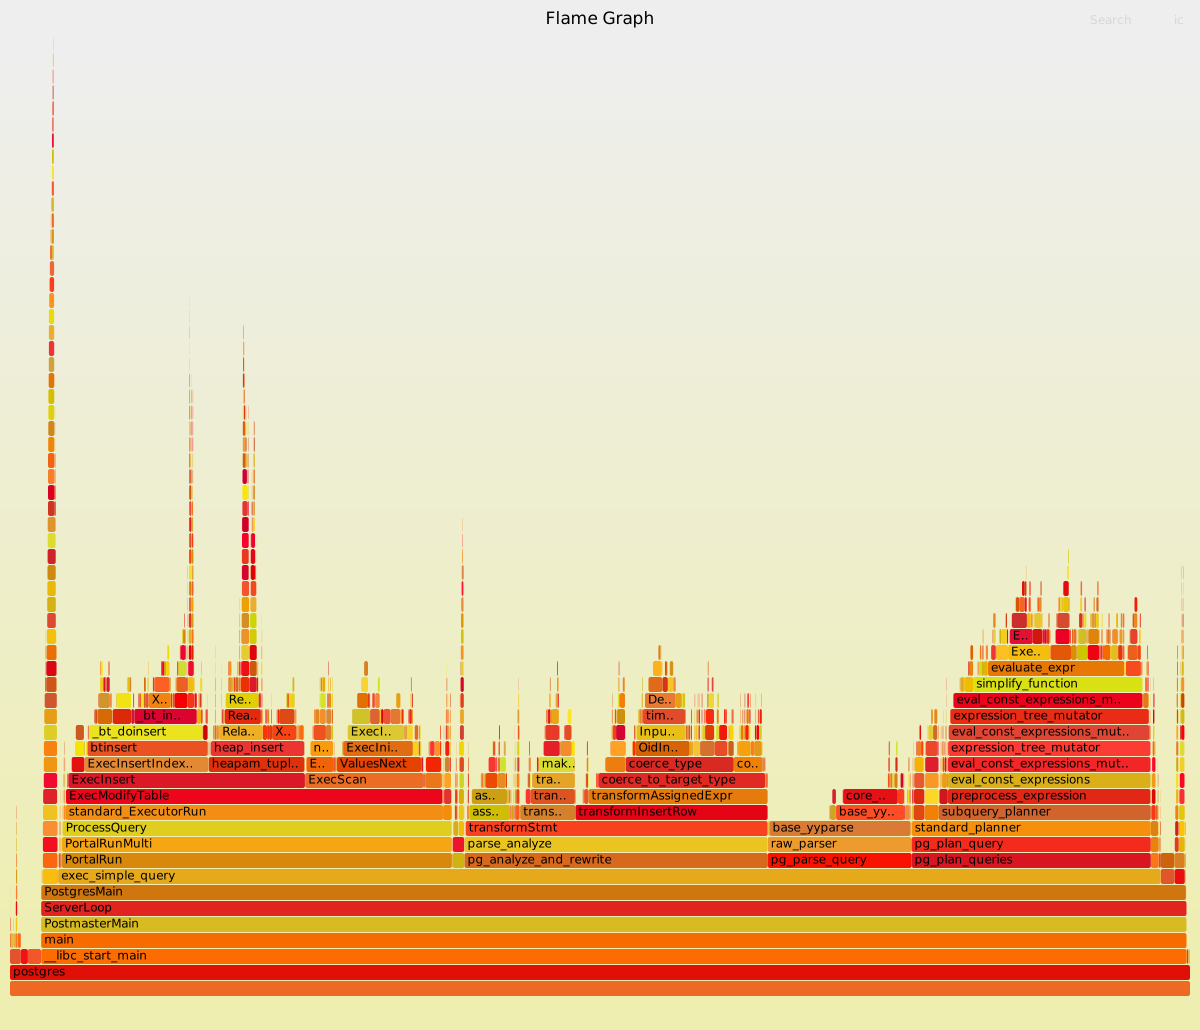
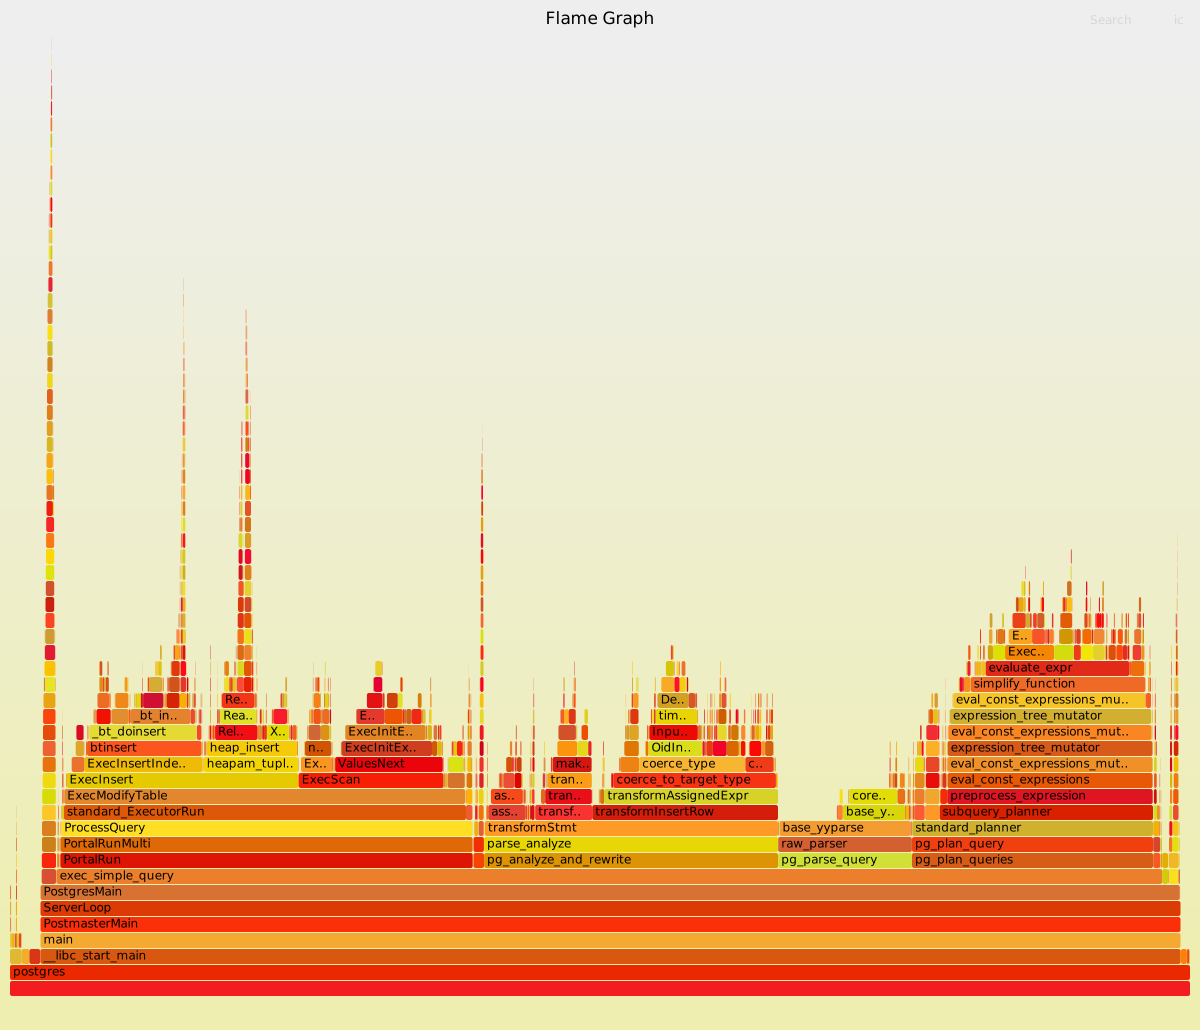
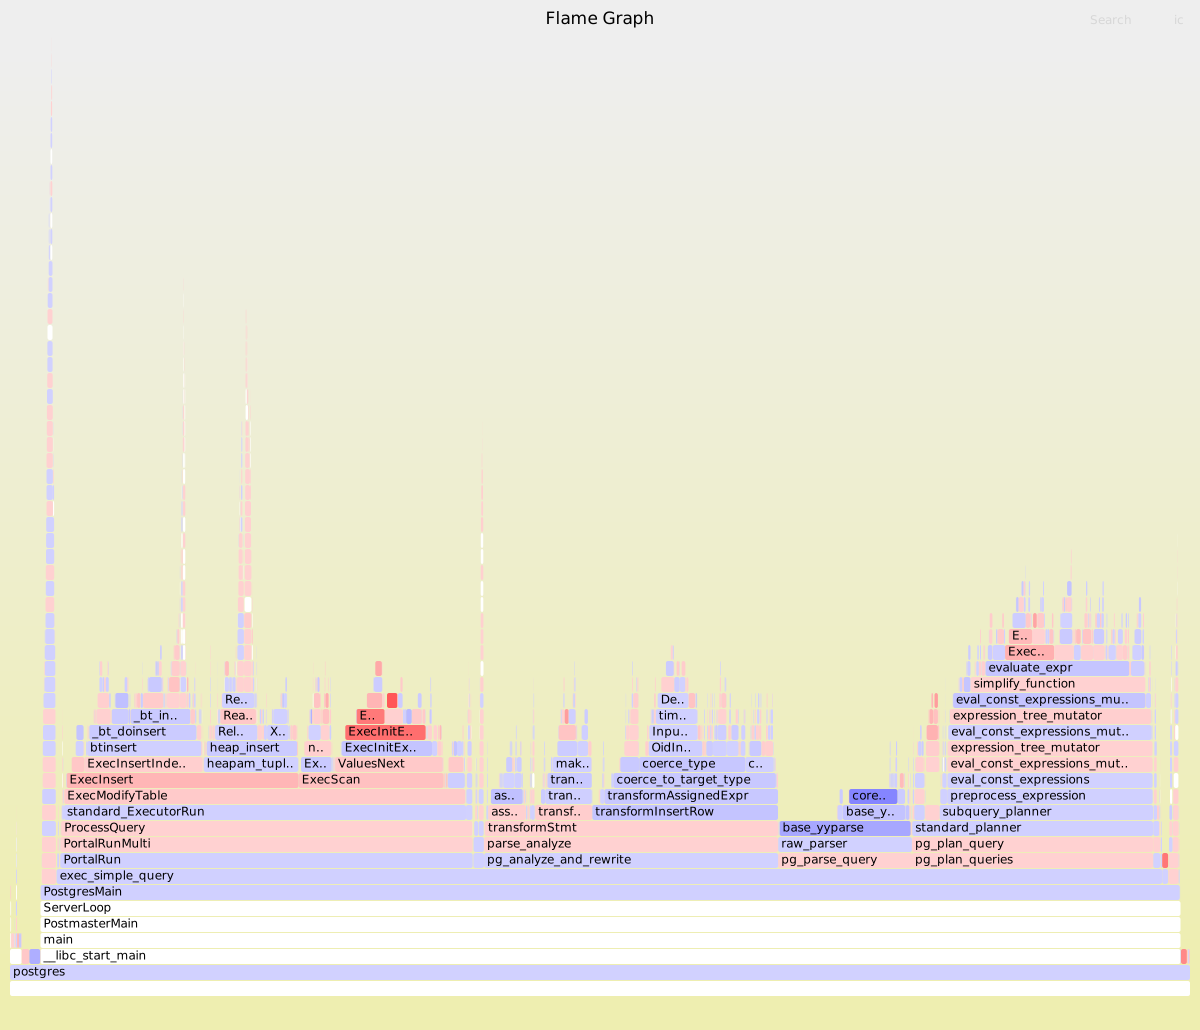
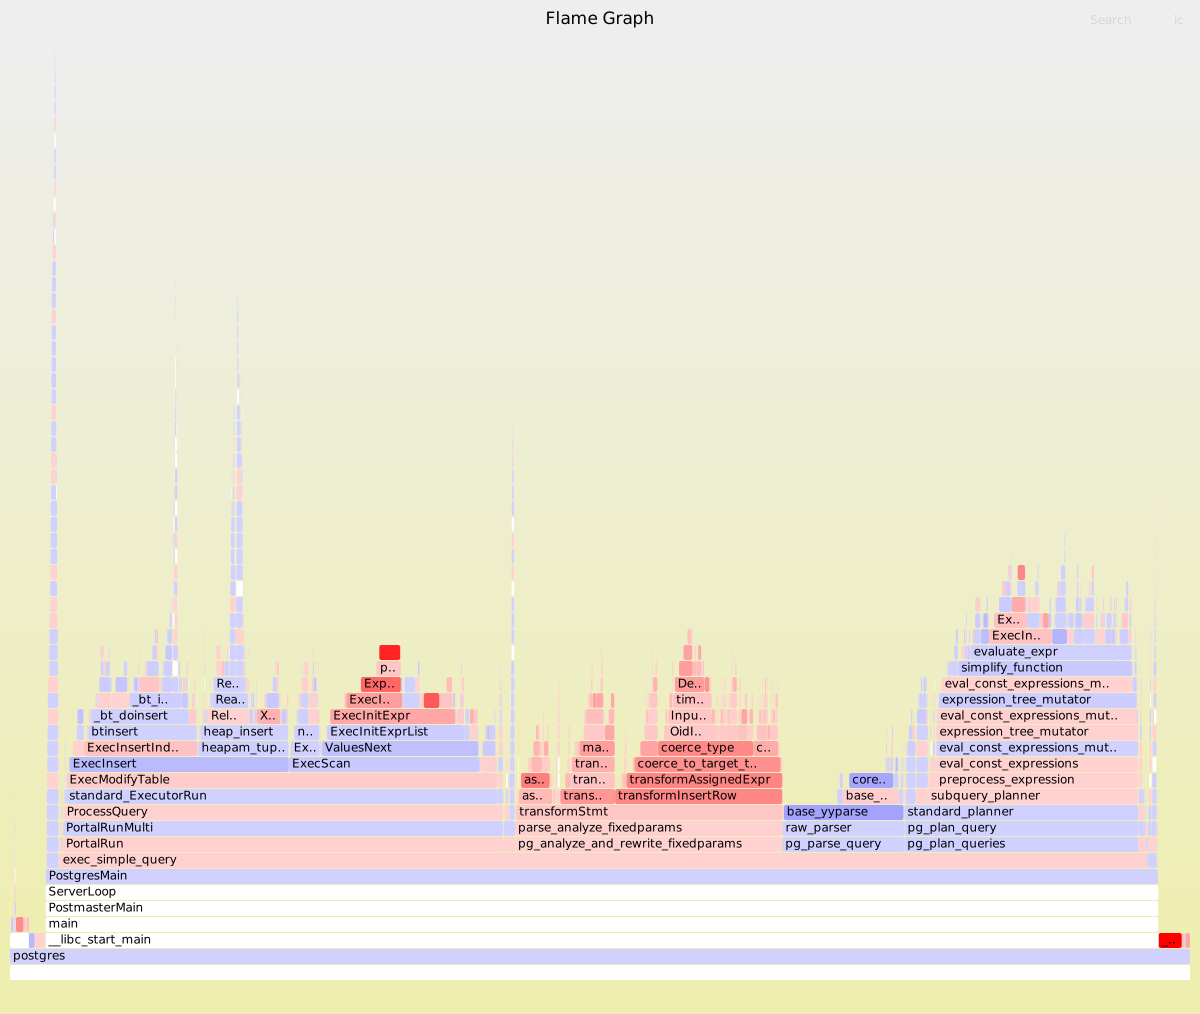
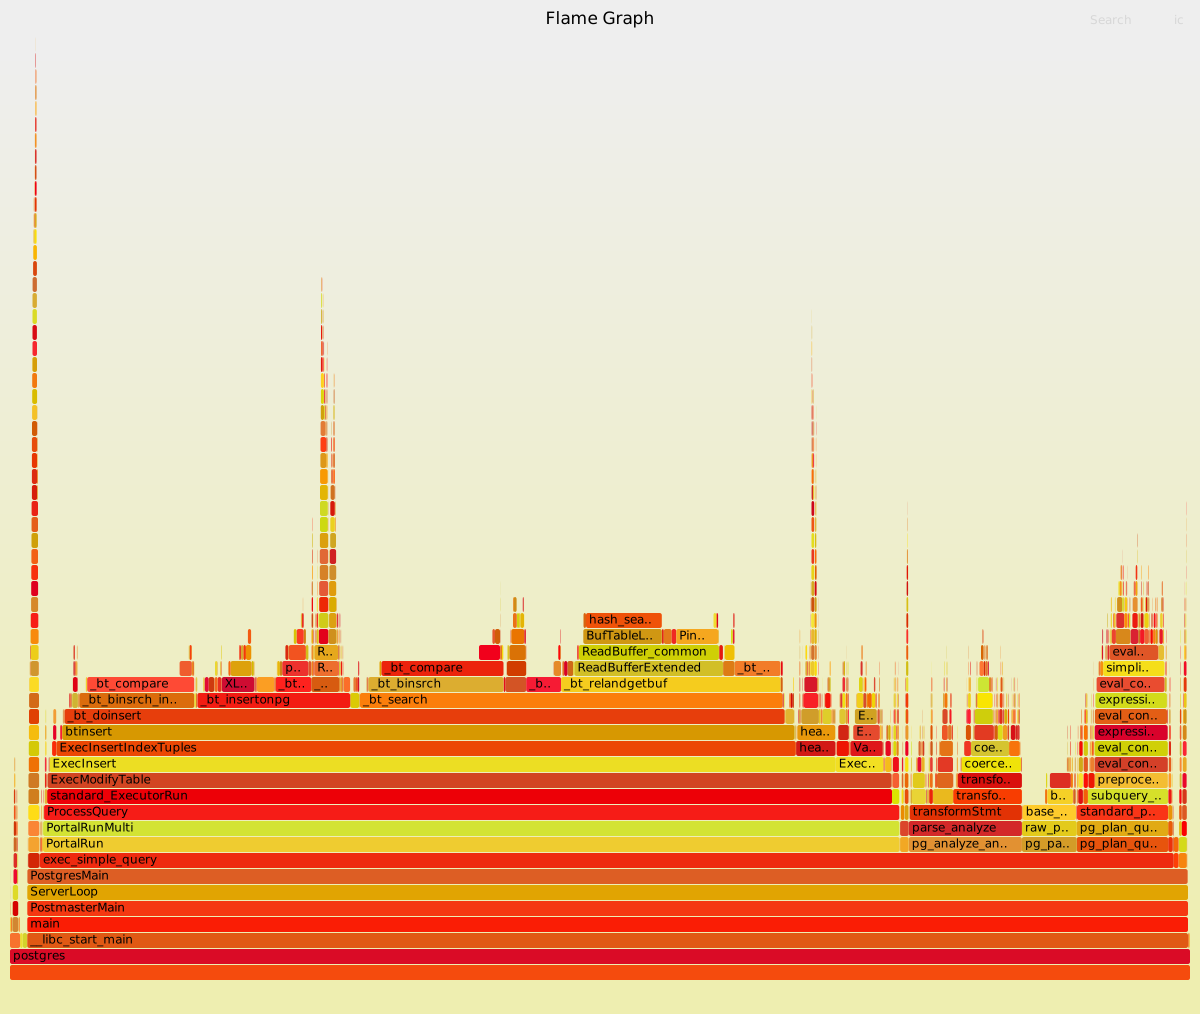
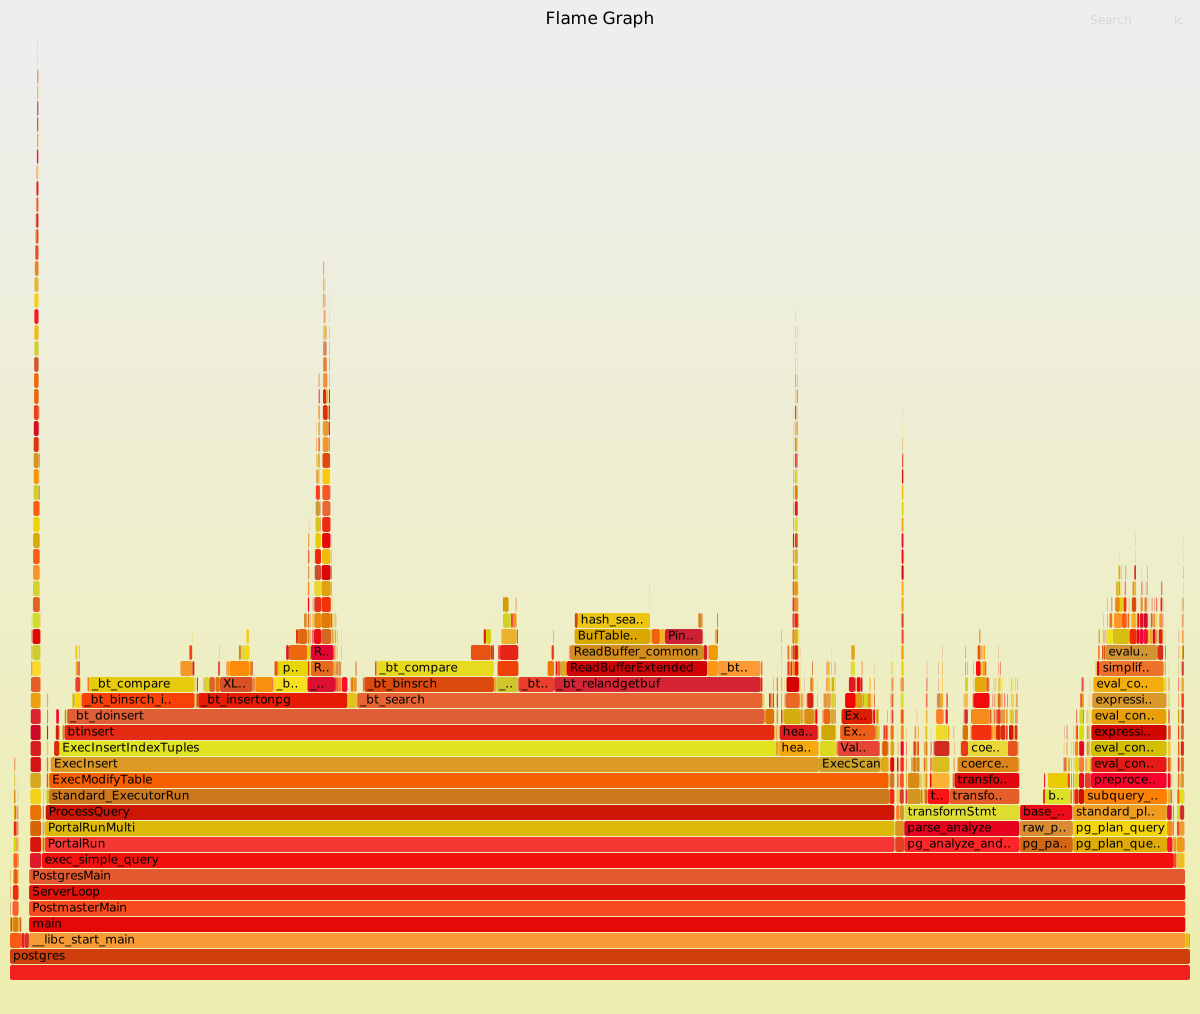
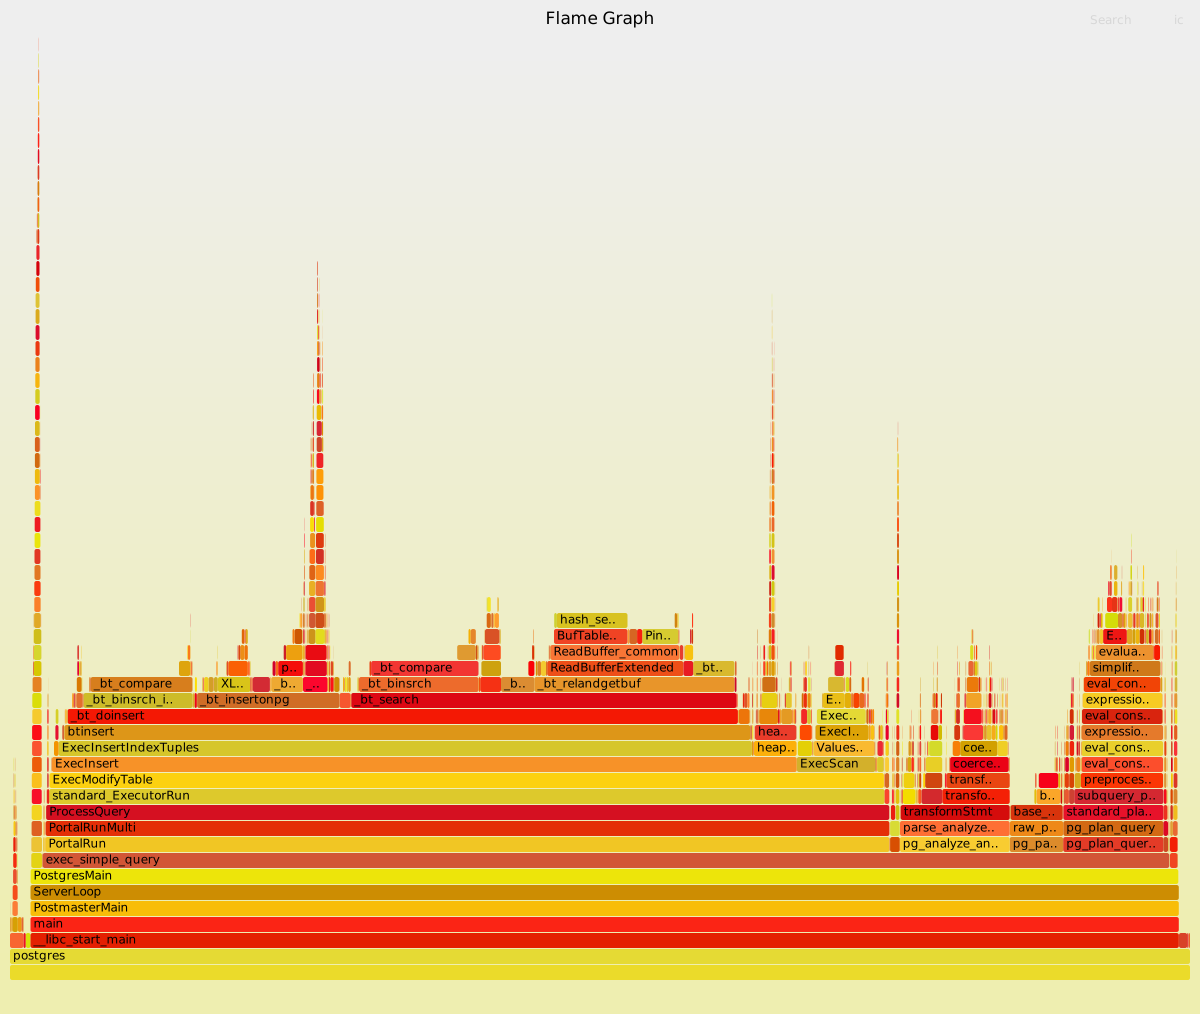
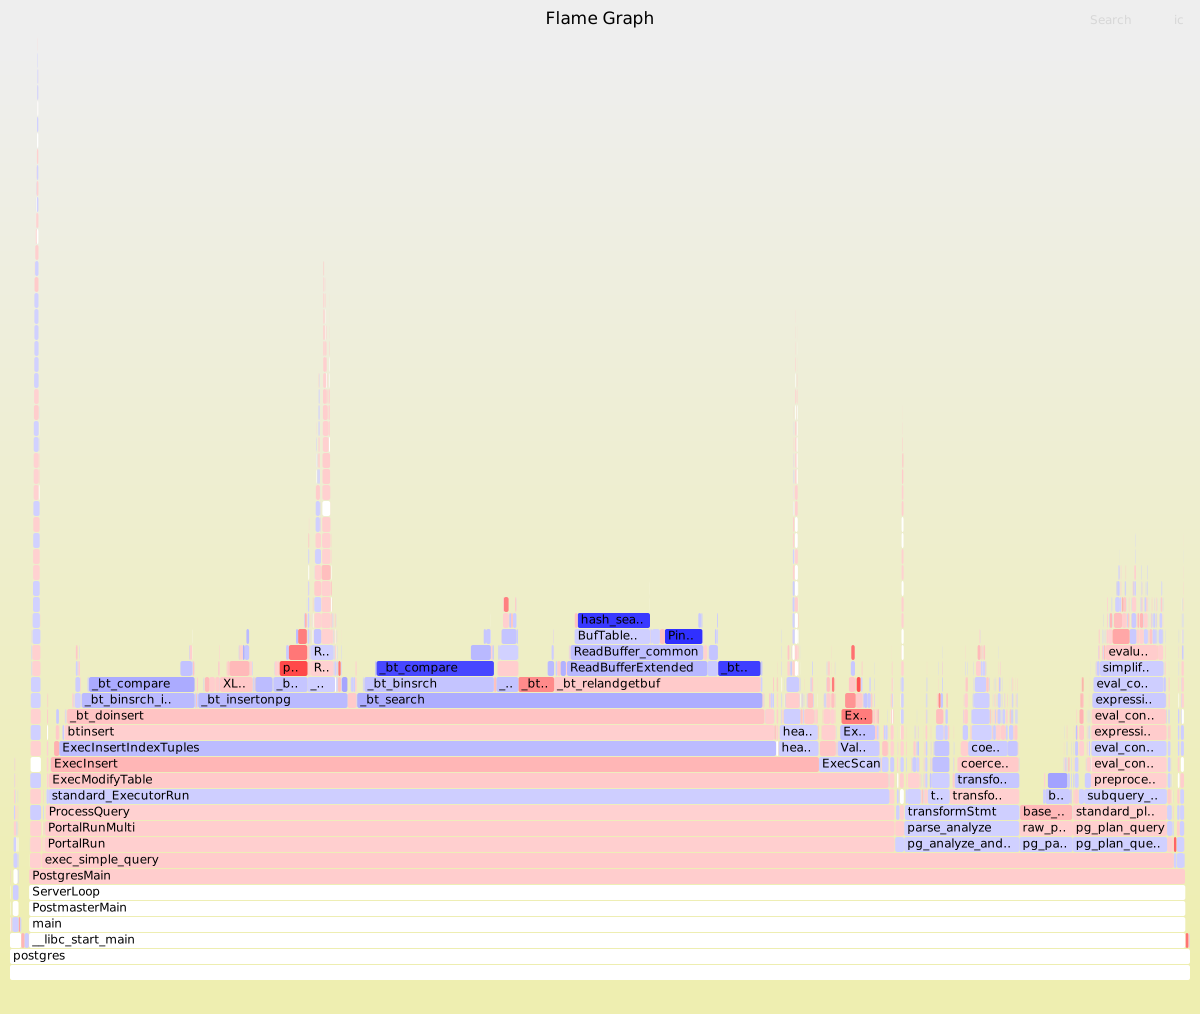
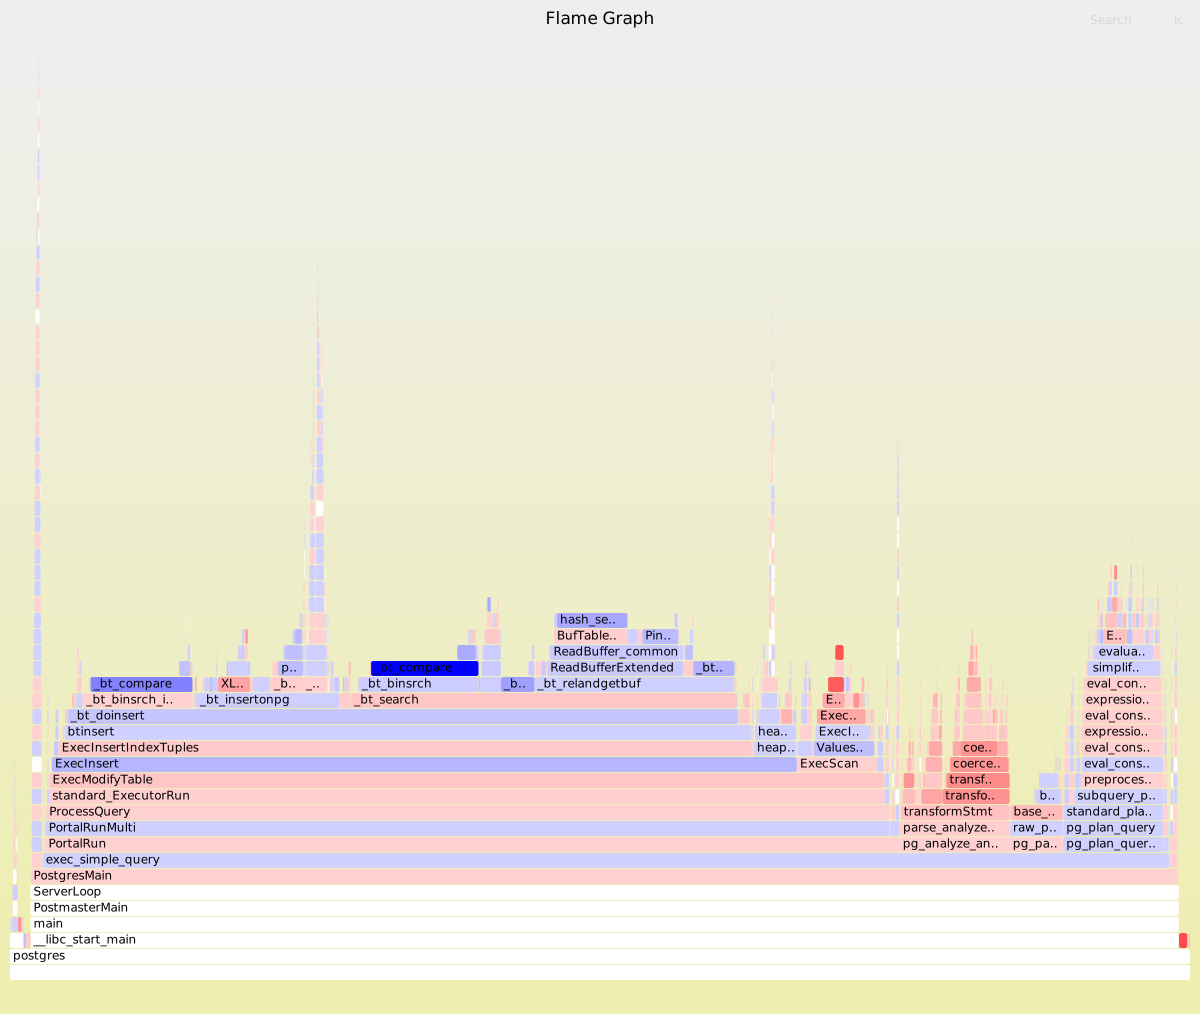
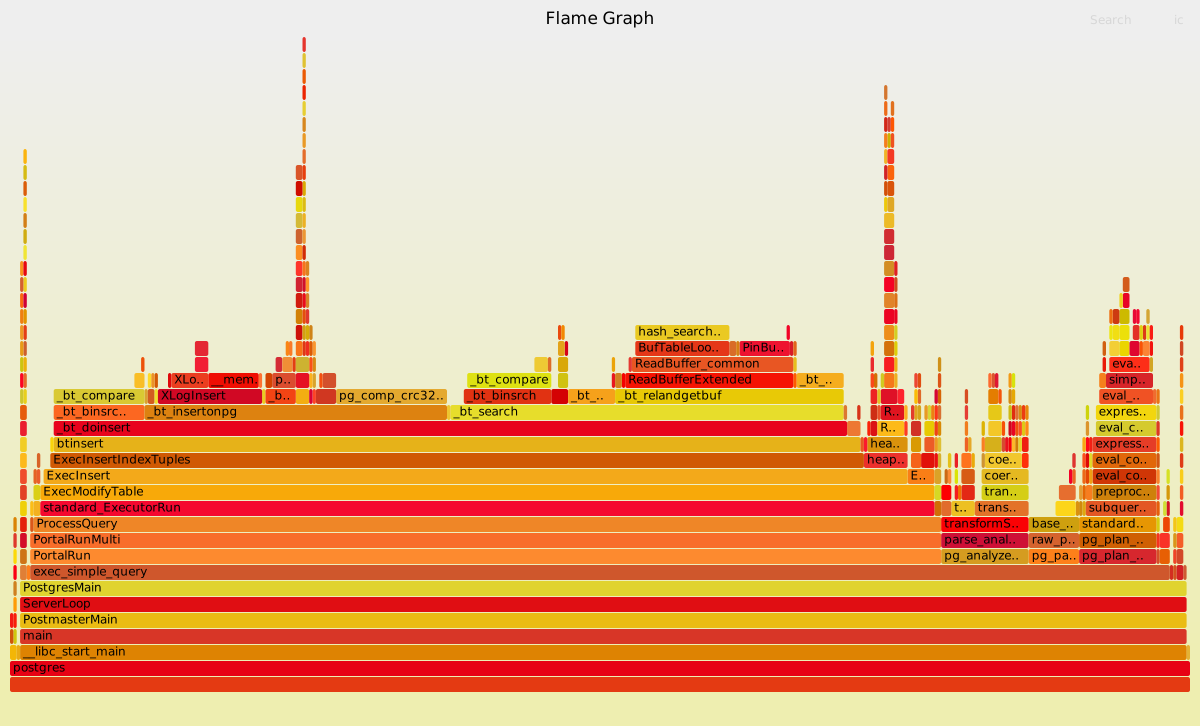
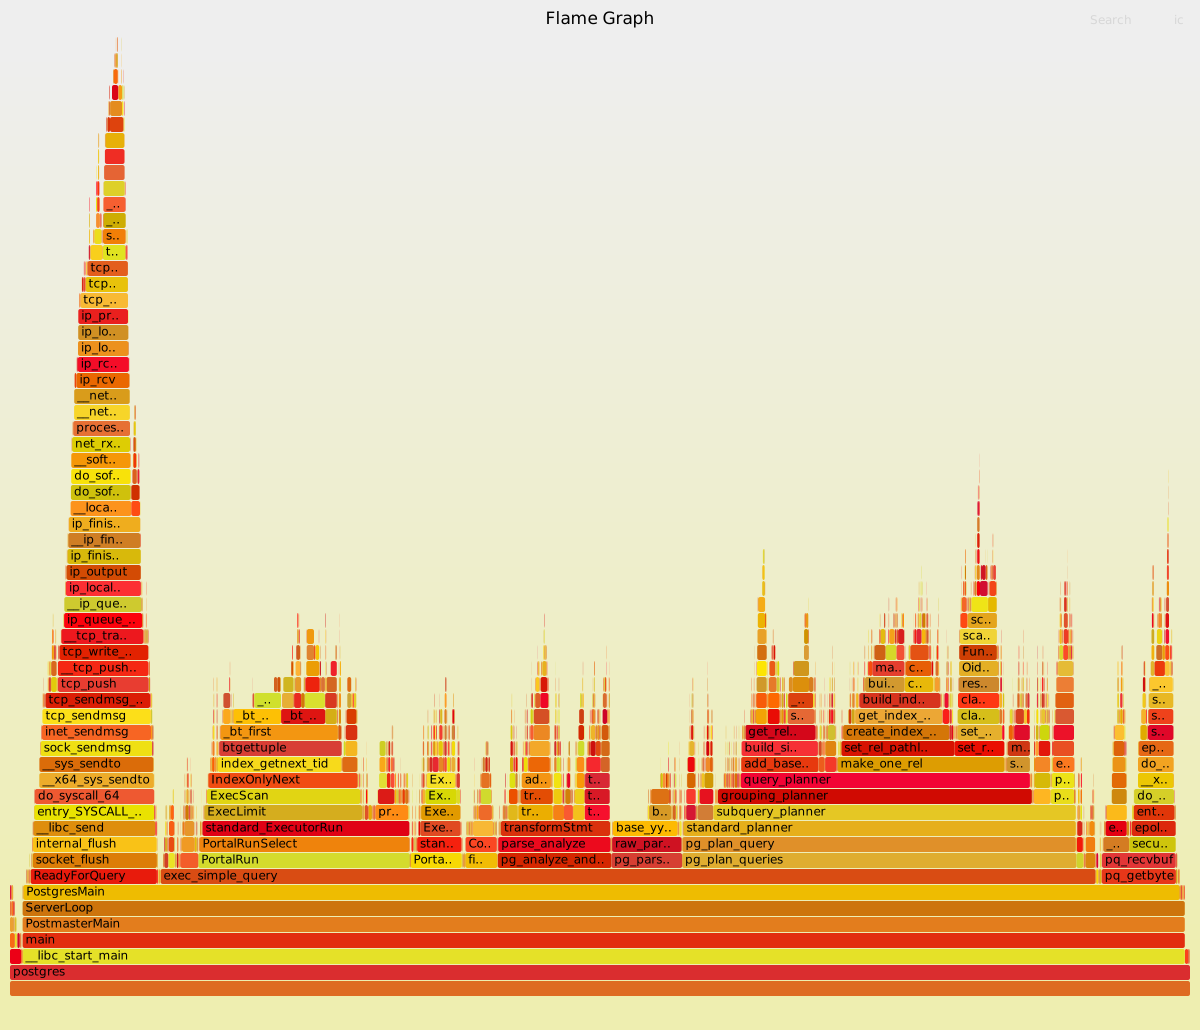
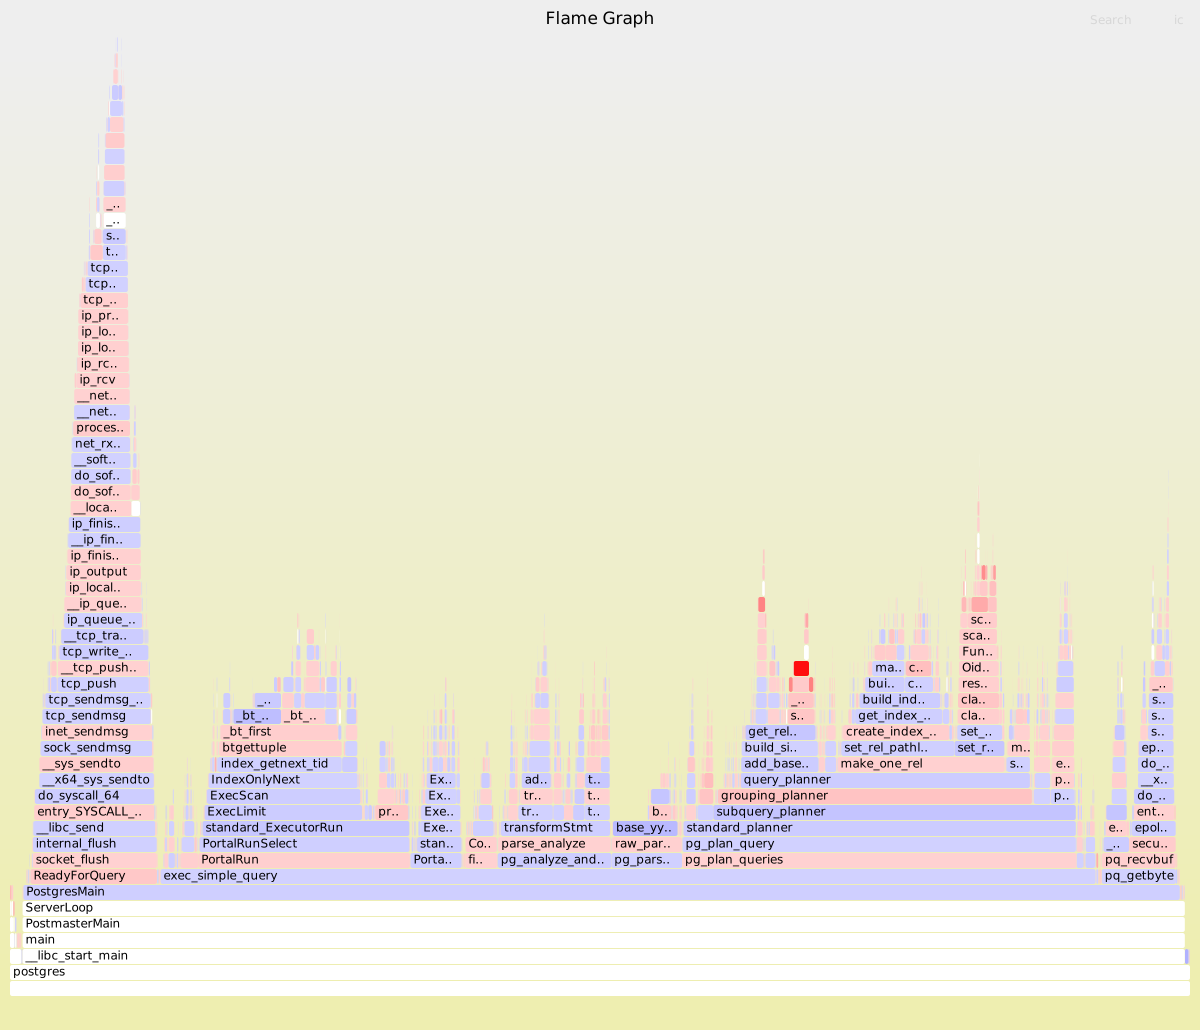
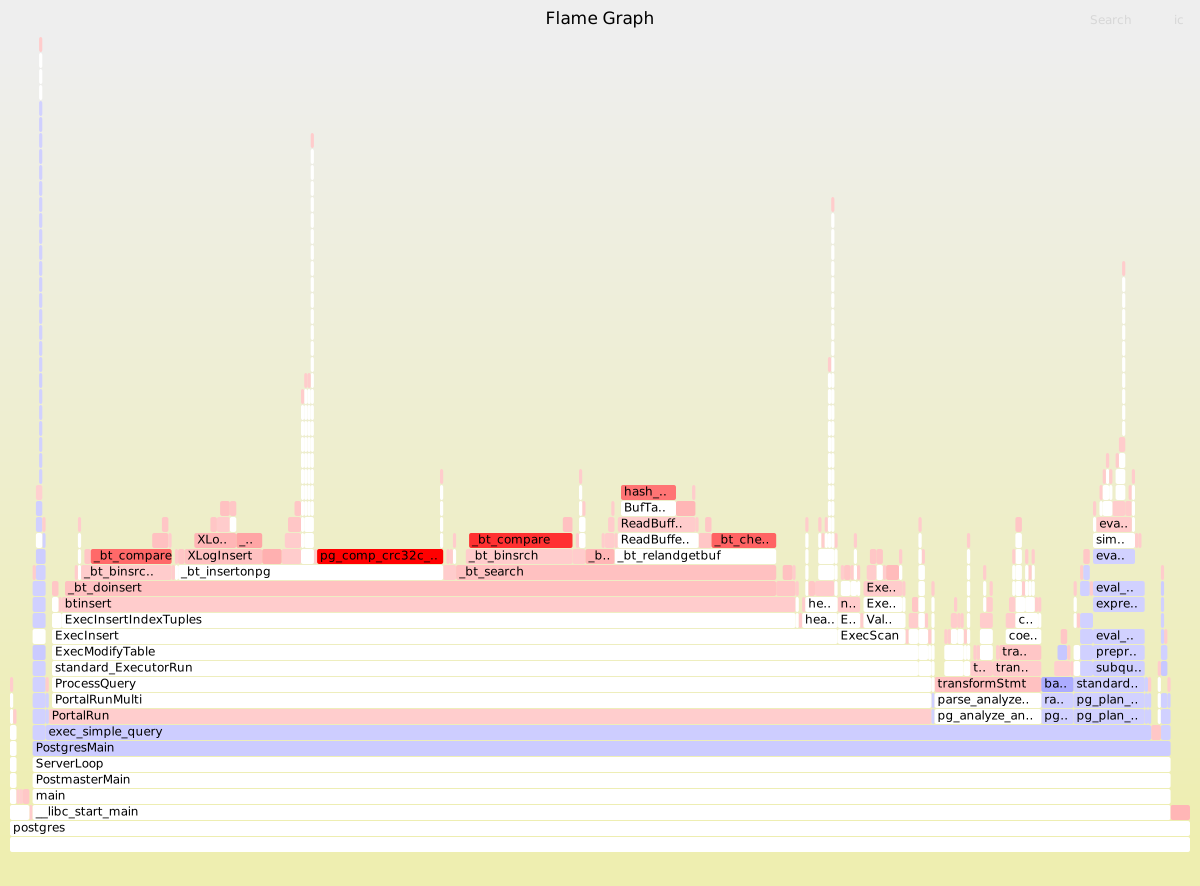
The largest regressions are from the l.i0 step. While this test doesn't run for a long time, the results are similar for the IO-bound workload. Flamegraphs are here for 12.11, 13.7, 14.3 and 15b1. Differential flamegraphs are here for 13.7 vs 14.3 and 14.3 vs 15b1. For 15b1 I renamed ExecInitExprInternal to ExecInitExpr to match the names used in older versions.

I also have a benchmark report here for Postgres versions 14.0, 14.1, 14.2 and 14.3. There is little change across them so any regressions from 13.7 to 14.3 are likely in 13.7 to 14.0.

Before looking at the differential flamegraphs I compared the output by hand. For functions called by PostgresMain not much changes between versions in pg_plan_queries and pg_parse_queries. There is a small improvement for pg_analyze_and_rewrite and a small regression for PortalRun. The rest of the drill down is here with a focus on functions called under PortalRun. There are regressions in a few functions when ExecScan is on the call stack.

Percentage of samples for children of PostgresMain
12.11   13.7    14.3    15b1    function
-----   -----   -----   -----   --------
21.50   20.27   20.44   19.84   pg_plan_queries
11.56   12.19   11.34   10.34   pg_parse_queries
25.76   25.70   24.92   22.64   pg_analyze_and_rewrite
33.02   33.06   34.94   37.31   PortalRun

Cached - l.i1

Flamegraphs are here for 12.11, 13.7, 14.3 and 15b1. Differential flamegraphs are here for 13.7 vs 14.3 and 14.3 vs 15b1. I didn't do the summary by hand because the differences are small.

Cached - q100.1

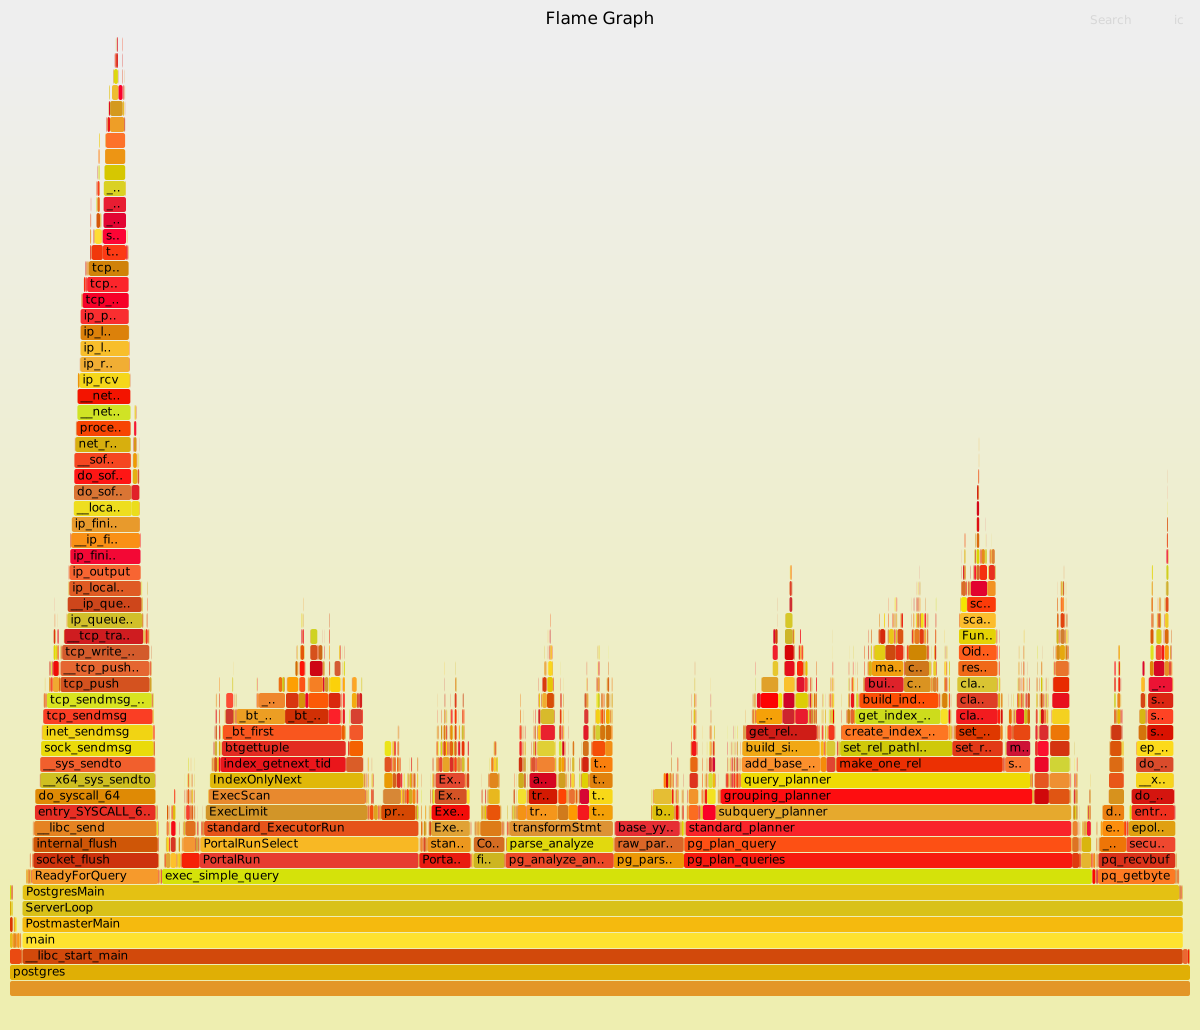
Flamegraphs are here for 12.11, 13.7, 14.3 and 15b1. Differential flamegraphs are here for 13.7 vs 14.3 and 14.3 vs 15b1. I didn't do the summary by hand because the differences are small. ReadyForQuery is much less prominent in 15b1 relative to earlier versions. It isn't clear that the differential graph for 14.3 vs 15b1 is useful. Perhaps too much code has changed.

Table and index sizes

These are the sizes from pg_index_sizes, pg_relation_size and pg_total_relation_size. I suspect that the improvements (size reduction) in recent Postgres versions don't reproduce here because the workload is insert only.

Legend
* all sizes are in MB unless indicated with G (for GB)
* index is value from pg_index_sizes
* rel is value from pg_relation_size
* total is value from pg_total_relation_size

l.i0 - after load in PK order without secondary indexes
version index   rel     total
12.11   428     1531    1959
13.7    428     1531    1959
14.3    428     1531    1959
15b1    428     1531    1959

l.x - after create 3 secondary indexes
version index   rel     total
12.11   2243    1538    3782
13.7    2243    1538    3782
14.3    2243    1538    3782
15b1    2243    1538    3782

l.i1 - after load more data with 3 secondary indexes to maintain
version index   rel     total
12.11   5299    3069    8368
13.7    5308    3069    8378
14.3    5308    3069    8378
15b1    5308    3069    8378

q3.1000 - at the end of the read+write steps
version index   rel     total
12.11   8338    3951    12G
13.7    8333    3950    12G
14.3    8333    3950    12G
15b1    8333    3950    12G

IO-bound workload

The reports are here for ibench without and with prepared statements used for queries. Next is a report for prepared statements and a patch for 15b1 (I call it 15b1p1) that fixes a CPU regression.

Postgres query throughput improves by ~1.5X when prepared statements are used for queries. Prepared statements are not yet used for inserts because I need to debug CPU perf issues on the ibench client. I still need to figure out why more IO isn't done per query for this workload given that it is IO bound and index indexes are much larger than memory.

I don't think the IO-bound report needs additional analysis as the regression for l.i0 is analyzed above. I also have a benchmark report here for Postgres versions 14.0, 14.1, 14.2 and 14.3. There is little change across them so any regressions from 13.7 to 14.3 are likely in 13.7 to 14.0.

Table and index sizes

These are the sizes from pg_index_sizes, pg_relation_size and pg_total_relation_size. I suspect that the improvements (size reduction) in recent Postgres versions don't reproduce here because the workload is insert only.

Legend
* all sizes are in GB
* index is value from pg_index_sizes
* rel is value from pg_relation_size
* total is value from pg_total_relation_size

l.i0 - after load in PK order without secondary indexes
version index   rel     total
12.11   10      37      48
13.7    10      37      48
14.3    10      37      48
15b1    10      37      48

l.x - after create 3 secondary indexes
version index   rel     total
12.11   55      37      92
13.7    55      37      92
14.3    55      37      92
15b1    55      37      92

l.i1 - after load more data with 3 secondary indexes to maintain
version index   rel     total
12.11   55      38      94
13.7    55      38      94
14.3    55      38      94
15b1    55      38      94

q3.1000 - at the end of the read+write steps
version index   rel     total
12.11   57      39      96
13.7    57      39      96
14.3    57      39      96
15b1    57      39      96

Debugging the regression

This section has details from trying to debug the regression while I collaborate with a few experts from the Postgres community. For the regression in the l.i1 benchmark step (load in PK order with 3 secondary indexes) on the IO-bound workload there is:

  • ~7% increase in KB written per insert(wkbpi)
  • ~7% increase in KB read per insert (rkbpq)
  • ~12% increase in CPU per insert (cpupq), but note that CPU here includes everything on the host, including the benchmark client

From pg_stat_bgwriter there are differences between 15b1 and 15b1p1 ...

select * from pg_stat_bgwriter is here for pg15b1p1:

checkpoints_timed     | 32

checkpoints_req       | 6

checkpoint_write_time | 7734090

checkpoint_sync_time  | 6471

buffers_checkpoint    | 12444695

buffers_clean         | 13580345

maxwritten_clean      | 0

buffers_backend       | 7593943

buffers_backend_fsync | 0

buffers_alloc         | 19970817

stats_reset           | 2022-06-23 21:45:38.834884-07

And then for pg15b1:


checkpoints_timed     | 37

checkpoints_req       | 2

checkpoint_write_time | 8283432

checkpoint_sync_time  | 6109

buffers_checkpoint    | 12753126

buffers_clean         | 13702867

maxwritten_clean      | 0

buffers_backend       | 6500038

buffers_backend_fsync | 0

buffers_alloc         | 20002787

stats_reset           | 2022-06-20 16:55:15.35976-07

And finally the graph of throughput vs time for l.i1 shows some kind of stall for 15b1p1 that doesn't occur for 15b1, and this stall is repeatable. It occurs in both runs of the benchmark I did for 15b1p1.

First is the graph for 15b1 which don't have the stall. The x-axis is time, the y-axis is inserts/s and the results are reported by the benchmark client at 1-second intervals.

Next is the graph for 15b1p1 which has a stall.


From a few more tests, this error message doesn't occur with 15b1 but does occur with 15b1p1 and variations of 15b1p1 that exclude some of the patches:
2022-06-27 ... PDT [1004196] ERROR:  canceling autovacuum task

The end

The regression is fixed and 15b1 with the patch now matches the performance from 13.7, so this fixed all of the regressions that arrived in version 14.

The fix for the regression comes in two parts. First, there is the patch that reduces CPU overhead. Second, I increased max_wal_size from 20G to 40G and that resolves some noise that shows up on the l.i1 (inserts with secondary index maintenenace) step. I started with the cx5 config that has max_wal_size set to 20G and then switched to the cx7 config that sets it to 40G.

The performance reports are here for the cached and IO-bound workloads.

The data below is from pg_stat_wal at the end of each benchmark step for versions 14.3, 15b1 and 15b1p1. All had wal_buffers = 16M. I don't know why wal_buffers_full and wal_write increased from 14.3 to 15b1, nor do I know whether that is an issue but this might explain whey I needed to increase max_wal_size from 20G to 40G. Most of that difference occurs during the l.x step (create secondary indexes).

from pg_stat_wal at end of l.i0
                        14.3    15b1    15b1p1
wal_records             1.0B    1.0B    1.0B
wal_fpi                 3.0M    3.0M    2.6M
wal_bytes               109.2B  109.5B  106.4B
wal_buffers_full        0       0       0
wal_write               4.5M    4.6M    4.5M
wal_sync                103K    103K    99K

from pg_stat_wal at end of l.ix
                        14.3    15b1    15b1p1
wal_records             1.0B    1.0B    1.0B
wal_fpi                 8.8M    9.3M    9.1M
wal_bytes               153.0B  157.1B  155.3B
wal_buffers_full        2.3M    3.5M    3.6M
wal_write               6.9M    8.2M    8.1M
wal_sync                107K    106K    102K

from pg_stat_wal at end of l.i1
                        14.3    15b1    15b1p1
wal_records             1.1B    1.1B    1.1B
wal_fpi                 26.3M   26.8M   26.5M
wal_bytes               285.5B  289.7B  287.4B
wal_buffers_full        2.3M    3.5M    3.6M
wal_write               7.1M    8.4M    8.3M
wal_sync                207K    207K    202K

CREATE INDEX in 15b2

Create index is ~3% slower for the IO-bound workload. See the summary and the metrics. I can reproduce this. The config file for these tests has max_parallel_workers = 0 so I assume that parallel index create isn't done.

From the metrics, this doesn't look like a CPU regression although I had to consult the vmstat output to confirm because the metrics page just shows cpupq = 4 for both. The average CPU utilization (us) is lower for 15b2 but the CPU/work is similar because the value of us * Nsamp is similar for 15b1 and 15b2 (Nsamp is the number of vmstat lines processed). Samples were take every second.

Averages from vmstat
cat 500m.pg15b1.cx7/l.x/o.vm.dop1 \
  | grep -v procs | grep -v swpd \
  | awk '{ c+=1; s12+=$12; s13+=$13; s14+=$14; s15+=$15; s16+=$16 } END { printf "%s\t%.1f\t%.1f\t%.1f\t%.1f\t%.1f\n", c, s12/c, s13/c, s14/c, s15/c, s16/c }'

version Nsamp   cs      us      sy      id      wa
15b1    415     769.7   21.3    3.0     73.1    2.6
15b2    426     752.2   20.8    3.0     73.0    3.2

From the metrics this also doesn't look like an IO regression because wkbpi and rkbpq haven't changed. For this benchmark step wkbpi is KB-written / Num-rows and rkbpq is KB-read / Num-rows where KB-written and KB-read are measured by iostat and Num-rows is the number of rows in the indexed table.

But from iostat output the values for r_await and w_await are larger for 15b2. HW (SSD thermal throttling in this case) is one cause, but programmers always love to start by blaming the HW. I will repeat this at night and let 15b2 run first.

cat 500m.pg15b1.cx7/l.x/o.io.dop1 \
  | grep nvme \
  | awk '{ c+=1; s2+=$2; s3+=$3; s4+=$4; s5+=$5; s6+=$6; s7+=$7; s8+=$8; s9+=$9; s10+=$10; s11+=$11; s12+=$12; s13+=$13 } END { printf "%s\t%.1f\t%.1f\t%.3f\t%.3f\t%.3f\t%.1f\t%.1f\t%.1f\t%.3f\t%.3f\t%.3f\t%.1f\n", c, s2/c, s3/c, s4/c, s5/c, s6/c, s7/c, s8/c, s9/c, s10/c, s11/c, s12/c, s13/c }'

version Nsamp   r/s     rkB/s   rrqm/s  %rrqm   r_await rareq-sz w/s    wkB/s   wrqm/s  %wrqm   w_await wareq-sz
15b1    414     666.0   84702.1 0.000   0.000   0.195   113.5   228.6   91061.3 3.820   2.048   6.010   331.7
15b2    425     648.2   82450.5 0.000   0.000   0.224   114.4   218.1   88508.5 3.428   2.017   7.271   342.5
CPU-bound sysbench on a large server: Postgres 12 to 19 beta1

This has results from sysbench on a small server with Postgres versions 12 through 19 beta1. Sysbench is run with high concurrency (40 conne...