I ran the insert benchmark on a Beelink SER 4700u that has 8 AMD cores, 16G RAM and NVMe SSD. I ran the test using 1, 2, 3 and 4 clients (threads) for MySQL (MyRocks, InnoDB) and Postgres.
tl;dr
- MySQL has CPU regressions from 5.6 to 8.0 that hurt performance
- Postgres does not suffer from such CPU regressions
- Postgres wasn't able to sustain the target insert rate (4000/s) for the IO-bound workload at 4 threads. InnoDB was able to thanks to the change buffer that reduces the IO overhead of secondary index maintenance. MyRocks also did great because non-unique secondary index maintenance is read free, so it is even more IO efficient than InnoDB.
- InnoDB does so much more IO/query than Postgres and MyRocks with the IO-bound workloads courtesy of MySQL bug 109595. I have been aware of this odd result for 10+ years and finally got the chance to debug it.
- MyRocks did much better than InnoDB and Postgres on l.i1 because non-unique secondary index maintenance is read free
Benchmark
For an overview of the insert benchmark see here and here. I ran it for two configurations: cached and IO-bound. The benchmark is a sequence of steps. The steps and their names are:
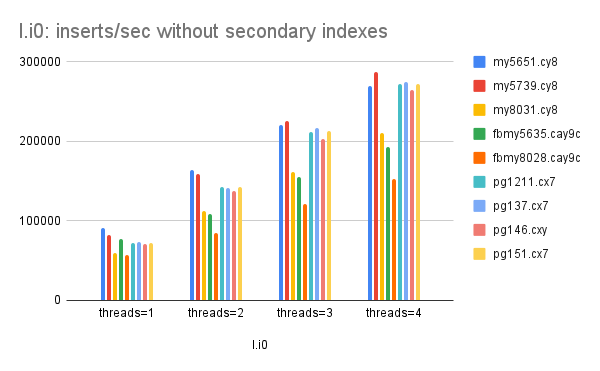
- l.i0 - insert X rows without secondary indexes
- l.x - create 3 secondary indexes
- l.i1 - insert another Y rows with the overhead of secondary index maintenance
- q100.1 - do queries as fast as possible with 100 inserts/s/thread done in the background
- q500.1 - do queries as fast as possible with 500 inserts/s/thread done in the background
- q1000.1 - do queries as fast as possible with 1000 inserts/s/thread done in the background
For cached X=20M and Y=20M. For IO-bound X=500M and Y=10M.
The insert benchmark has a few problems so I will replace it later this year. The problems include:
- The Python code uses too much CPU
- The l.i0 and l.i1 steps are insert-only and can't run for a long time for workloads that are intended to stay in-memory.
- The read+write steps (q100.1, ...) that measure query performance are easily cached by some DBMS (like Postgres) but not by others which makes comparisons hard for workloads intended to be IO-bound.
- I don't test the ability to replicate the high write rates sustained by l.i0 and l.i1. That takes more time to setup, more hardware and a good network switch. Note this problem is likely to repeat with whatever replaces the insert benchmark.
- The benchmark clients (Python) share the server. This is unlikely to match how the DBMS is used in production. It also skips some of the networking code in the DBMS.
Reports
Performance summaries generated by shell scripts are below. A short guide to these results is here.
- MySQL
- Cached: 1 thread, 2 threads, 3 threads, 4 threads
- IO-bound: 1 thread, 2 threads, 3 threads, 4 threads
- Postgres:
Reports: cpu regression
These help explain performance especially the regressions for MySQL from 5.6 to 8.0. The cpupq column is the amount of CPU consumed per operation (insert or query). For a cached database the CPU overhead (cpupq) grows a lot from MySQL 5.6.51 to 8.0.31 with InnoDB. The growth is similar for MyRocks but I will skip that for now. Metrics for InnoDB/MySQL are here for 1 thread, 2 threads and 3 threads.
- l.i0
- cpupq grows from 19 to 29 for 1 thread
- cpupq grows from 19 to 30 for 2 threads
- cpupq grows from 20 to 29 for 3 threads
- l.i1
- cpupq grows from 42 to 63 for 1 thread
- cpupq grows from 48 to 66 for 2 threads
- cpupq grows from 51 to 64 for 3 threads
- q100.1
- cpupq grows from 194 to 347 for 1 thread
- cpupq grows from 188 to 337 for 2 threads
- cpupq grows from 184 to 306 for 3 threads
Reports: QPS differences
They also explain the difference in QPS between Postgres and MySQL for the q100.1, q500.1 and q1000.1 steps with the IO-bound setup. Using the 1 thread results for MySQL and Postgres:
- MyRocks and Postgres don't do much IO/query (rpq, reads/query, ~= 0.02) but MyRocks uses ~4X more CPU/query (cpupq).
- InnoDB does much IO/query (rpq ~= 4.8)
And today is the day for me to explain why InnoDB does too much IO/query. I rules out purge because history list length was ~0. I also ruled out the change buffer after getting the same result with it enabled or disabled. The root cause is MySQL bug 109595. The optimizer + InnoDB do too many disk reads thanks to records_in_range. With the fix the InnoDB QPS for q100.1 increases from ~1000/s to ~3500/s because disk reads/query drop from ~4.5 to ~0.02.
Reports: inserts with secondary index maintenance
The l.i1 benchmark step measures the insert rate when there are 3 secondary indexes to maintain. The insert rate for MyRocks is similar for the cached and IO-bound workloads. That is definitely not true for InnoDB and Postgres. The reason is that non-unique secondary index maintenance is read free for MyRocks. The rpq (reads/operation) column makes this clear. It is ~0 for MyRocks, ~0.5 for InnoDB and ~1.3 for Postgres with the IO-bound workload.
Reports: read+write and target insert rate
Postgres was unable to sustain the target insert rate (4000/s) for the q1000.1 benchmark step with 4 threads. These benchmark steps have N threads doing queries as fast as possible and then N more threads doing rate limited writes. In this benchmark there were 3 steps with 100, 500 and then 1000 inserts/s per thread and Postgres failed to sustain 1000 inserts/s/thread when there were 4 threads.
The root cause for this is IO efficiency where MyRocks is the most IO efficient for inserts because non-unique secondary index maintenance is read free. And then InnoDB is the next most IO efficient because the change buffer reduces IO for secondary index maintenance. Finally there is Postgres which doesn't have any IO efficiency optimizations for index maintenance.
To understand the impact, first look at the IO/insert during l.i1 (inserts with 3 secondary indexes to maintain) using the rpq (reads/operation) and wpi (writes/insert) columns from the metrics tables for MySQL and for Postgres using the run with 1 thread.
- for MyRocks & 8.0.28 - rpq=0 and wpi=0.004
- for InnoDB in 8.0.31 - rpq=0.510 and wpi=1.112
- for Postgres & 15.1 - rpq=1.351 and wpi=1.714
Note that the rpq and wpi values for MyRocks are harder to compare with a B-Tree because much of the IO is from compaction using larger requests. The InnoDB doublewrite buffer also makes this complicated. So we can also look at rkbpq and wkbpi which are read KB/insert and write KB/insert.
- for MyRocks & 8.0.28 - rkbpq=0 and wkbpi=0.854
- for InnoDB & 8.0.31 - rkbpq=8.166 and wkbpi=32.908
- for Postgres & 15.1 - rkbpq=11.027 and wkbpi=27.239
The page size was 8kb for MyRocks, 16kb for InnoDB and 8kb for Postgres. The config files are here for MyRocks, InnoDB and Postgres.
But from the above, Postgres appears to be the least IO efficient for inserts because is does ~3 IOs (rpq+wpi) per insert, while InnoDB does ~1.6 and MyRocks does something much closer to zero. The impact of being less IO efficient is that the target insert rate of 4000/s cannot be sustained for the q1000.1 benchmark step from the combination of IO latency and IO demanded/insert. Metrics for q1000.1 with 4 threads and Postgres is here. More info on the IO capacity of the Beelink servers I used for the benchmarks will arrive soon in another post.
But from the above, Postgres appears to be the least IO efficient for inserts because is does ~3 IOs (rpq+wpi) per insert, while InnoDB does ~1.6 and MyRocks does something much closer to zero. The impact of being less IO efficient is that the target insert rate of 4000/s cannot be sustained for the q1000.1 benchmark step from the combination of IO latency and IO demanded/insert. Metrics for q1000.1 with 4 threads and Postgres is here. More info on the IO capacity of the Beelink servers I used for the benchmarks will arrive soon in another post.
Graphs for the cached workload
These graphs have results from the cached workload for all of the DBMS. They make it easy to see both the regressions in MySQL and the lack of them in Postgres.


Graphs for the IO-bound workload
These graphs have results from the IO-bound workload for all of the DBMS. They make it easy to see both the regressions in MySQL and the lack of them in Postgres.


No comments:
Post a Comment