Last October someone asked on the RocksDB email list whether RocksDB can use all of the IO capacity of a fast storage device. They provided more context -- they want to use it to cache objects that are ~4kb and give RocksDB as little memory as possible and the workload is mostly point queries (RocksDB Get).
That person provided a shell script to show how they used db_bench to test this. I started with that script, we had some discussion on that thread and then I went quiet. At last I have some results to share. To be clear, I am trying to answer two questions. First, can the QPS rate for RocksDB approach the IO capacity of the storage system. Second, can the IO rate for a RocksDB benchmark approach the IO capacity of the storage system. And the context is a for a read-mostly/large-object workload that gives RocksDB as little memory as possible. The RocksDB workload should do ~1 IO/query for the answer to the first question to be true. If it does much more than 1 per query then we are trying to answer the second question.
Results vary based on whether the block cache is too small versus large enough. Unfortunately, for many workloads it isn't easy to determine what is large enough. By large enough I mean that the metadata working set fits in the block cache (bloom filters and index blocks). Alas, making this estimate can be hard especially with a database that grows or shrinks over time. Partitioned metadata is a solution if you don't want to figure out the proper size for your block cache (which isn't easy) or if you don't have enough memory.
I took too long to writeup these experiments and lost some details with respect to the hardware used and benchmark command lines. Also, I feel like a character from Severance while doing writeups like this. There is much time looking for scary numbers.
tl;dr
- In some cases RocksDB can saturate the IO capacity for a server for an IO-bound and read-heavy workload -- either efficiently (doing 1 IO/query or inefficiently (doing extra IOs/query).
- You can spend on memory to reduce IO demand or spend on IO to reduce memory demand.
- The price to pay for a too-small block cache is more IO/query. That price is larger with non-partitioned metadata.
- When the block cache is large enough the price to pay for partitioned metadata is more CPU/query and more IO/query. However this price appears to be larger with big servers than with small and explaining that is on my TODO list.
- One of the server types (Beelink) gets more IOPs from fio with O_DIRECT+filesystem than it does from the same SSD accessed as a raw device. I have no idea why.
Well, actually
Can RocksDB saturate an IO device? It depends and there are several factors to consider:
- CPU - it takes CPU to do IO. On a variety of hosts the CPU overhead per IO is ~10 usecs from Linux (kernel and userland, measured with fio) and then in the best case RocksDB uses another ~20 usecs/query for point queries that read ~4kb values from storage per query. So in the best case that is 30 usecs of CPU time per IO which means the peak rate is ~33k queries per core. In this case I need at least 10 CPU cores to consume ~330k IO/s. The 20 usecs/query for RocksDB ignores decompression which adds another 1 to 5 usecs per block read from storage (~1 usec for lz4, ~5 for zstd).
- memory - you can spend more on memory (larger RocksDB block cache) to save on IO or you can spend more on IO to save on memory (smaller RocksDB block cache). In the best case for an IO-bound workload there is one read from storage per query. To achieve that all (or most) of the RocksDB metadata (bloom filter, index) blocks must be in memory.
- partitioned metadata blocks - the db_bench option --partition_index_and_filters can be set to partition index and bloom filter blocks (split them into pieces). The cost of partitioned index and filter blocks is more CPU overhead (discussed below) but the benefit is large for workloads when the working set doesn't fit in the RocksDB block cache. When all metadata can't be cached and partitioning isn't enabled then there will be frequent large IO requests (large == several hundred KB) to read index and filter blocks and this is bad for performance. Using partitioned metadata blocks avoids this problem. If you don't use partitioned metadata blocks then you will have to manually tune, or guess, at the amount of memory needed for the RocksDB block cache to avoid the problem.
- IO capacity - obviously it is easier for RocksDB to saturate the IO capacity of a slow storage device (spinning disk or cloud storage) than a fast one (local attached SSD). But another important part of the context is concurrency. For most storage systems the IO capacity is a function of concurrency -- with more concurrency there will be more IO/second up to a point.
- I didn't enable the option to align blocks, db_bench --block_align is false by default for Leveled compaction and there is no option for block align with BlobDB. There is a trade to be had with --block_align -- when enabled it might reduce IOPs and bytes transferred from storage per user query but when disabled the database uses less space.
- The workload fetches 4kb of user data per point query and RocksDB adds a few bytes of metadata to a data block. Thus, without compression (I didn't enable it) RocksDB must fetch a bit more than 4kb of data to get a 4kb value so it always must fetch 4kb + one sector (sector might be 512 or 4096 bytes).
Hardware
I used a variety of hardware:
- work
- 80 HW threads with hyperthreading enabled, 256G RAM, several local attach NVMe SSD
- tests used 8 x 300G files and were run for 1, 5, 10, 20, 30 and 40 threads
- NUC
- Intel NUC with 4 cores, 16G RAM and local attach NVMe (see here)
- tests used 8 x 20G files and were run for 1, 4, 8, 16, 24 and 32 threads
- Beelink
- Beelink with 8 AMD cores, 16G RAM and local attach NVMe (see here). All results are provided for this with the original (Kingston) SSD and some results with the new (Samsung 980 Pro) SSD
- tests used 8 x 20G files and were run for 1, 4, 8, 16, 24 and 32 threads
- AWS
- c7g.16xlarge with 64 cores, 128G RAM and EBS (io2, 5T, 100k+ IOPs)
- tests used 8 x 300G files and were run for 1, 2, 5, 10, 20, 30, 40 and 60 threads
- GCP
- c2-standard-60 with 30 cores (hyperthreading disabled), 240G RAM and SSD Persistent disk (maybe 5T)
- tests used 8 x 300G files and were run for 1, 5, 10, 20 and 30 threads
I first used fio to quantify the IO throughput I could get at different concurrency levels. The script is here and was repeated for raw devices, O_DIRECT and buffered IO. I used the psync IO engine so pread (synchronous IO) was used and there would be one pending IO per thread to match what RocksDB does in most cases.
I then used db_bench via the runit.sh script that invokes the q.sh script that invokes db_bench. Tests were repeated for Leveled compaction and integrated BlobDB in each case with partitioned metadata blocks enabled and disabled.
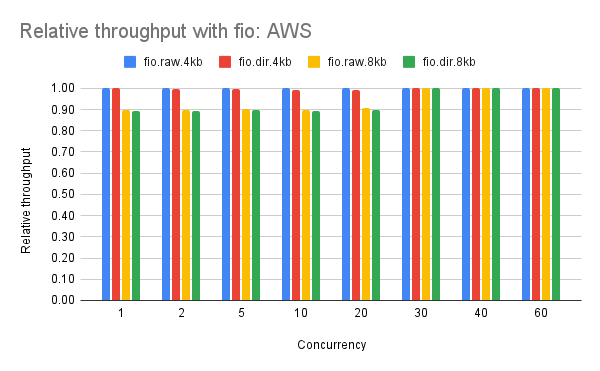
The benchmarks with fio are:
- fio.raw.4kb - fio does 4kb random reads on a raw device
- fio.dir.4kb - fio does 4kb random reads with O_DIRECT
- fio.raw.8kb - fio does 8kb random reads on a raw device
- fio.dir.8kb - fio does 8kb random reads with O_DIRECT
- 4096b.dir.blob.p1 - uses O_DIRECT, BlobDB and partitioned metadata
- 4096b.dir.blob.p0 - uses O_DIRECT, BlobDB but doesn't use partitioned metadata
- 4096b.dir.lev.p1 - uses O_DIRECT, Leveled compaction and partitioned metadata
- 4096b.dir.lev.p0 - uses O_DIRECT, Leveled compaction but doesn't use partitioned metadata
Results
A spreadsheet with all of the details is here. The spreadsheet lists the absolute and relative QPS by concurrency level. The relative QPS is relative to the base case (fio with a raw device doing 4kb reads). For each tab on the spreadsheet the left hand side has the throughput (reads/s) and the right side has the relative QPS.
While I won't explain how to decode them, files with more performance details including IO latency and CPU/query are here for work, NUC, Beelink, AWS and GCP.
Results from fio
The interesting results:
- The bottleneck is IOPs, transfer rate or both.
- It is IOPs when the 4kb and 8kb results are similar.
- It is transfer rate when the 4kb results are significantly better.
- It is both when the 4kb results are better but not significantly better
- For now I claim that similar means 10% or less difference (IOPs bottleneck), significantly better means a 30% or more difference (transfer rate bottleneck) and anything in between means the bottleneck is both IOPs and transfer rate.
- Note that this classification changes with concurrency for some devices.
- Using a raw device gets the best throughput for all devices except the Beelink. For the Beelink the fio.dir.4kb (O_DIRECT, 4kb reads) run has the best throughput. I have yet to learn why but if you scroll to the Update 1 section at the end of this post I provide details that start to explain this.
- NUC
- IOPs at low concurrency, both at mid concurrency, transfer rate at high concurrency
- Beelink with original SSD
- Both at all concurrency levels
- Beelink with new SSD
- Transfer rate at all concurrency levels
- The results confuse me because the read IOPs is larger with O_DIRECT+filesystem than accessing the SSD as a raw device.
- AWS
- IOPs at all concurrency levels. This is expected with AWS where a read <= 256kb counts as one IO and EBS provided ~80k IOPs.
- GCP
- For raw it was IOPs at all concurrency levels
- For O_DIRECT it was both at low and mid concurrency, IOPs at high
- Work
- IOPs at all concurrency levels


Results from db_bench
I share 4 graphs for two server types; Work and NUC. Graphs for the other server types are in the spreadsheet and all look similar to the graphs I share here. The graphs are from db_bench for a read-only workload that reads 4kb values and the benchmark is repeated for different block cache sizes. The goal is to determine the impact of using a larger block cache.
The four graphs are:
- BlobDB with partitioned metadata
- BlobDB without partitioned metadata
- Leveled compaction with partitioned metadata
- Leveled compaction without partitioned metadata


These graphs show (QPS with partitioned metadata / QPS without partitioned metadata) for Leveled compaction. There is a performance penalty for partitioned metadata (relative QPS is much less than 1.0) for the Work and GCP servers but not for the NUC and Beelink servers (explaining that is on my TODO list). Regardless, there is a huge benefit from using partitioned metadata when the block cache is too small


QPS for partitioned vs non-partitioned: tables
Tables with data for graphs from the previous section.
Work server
NUC
Beelink
GCP
- For the big servers (Work and GCP) the performance with non-partitioned metadata is better than with partitioned metadata. Also, HW efficiency is worse with partitioned metadata as there is more IO/query (1.1 vs 1.0, 1.3 vs 1.0) and more CPU/query (39 vs 31 usecs, 57 vs 41 usecs).
- For the small servers the performance with non-partitioned and partitioned metadata are similar.
This is an attempt to explain why I get more IOPs with O_DIRECT + XFS vs raw devices when using fio on my Beelink servers. For the O_DIRECT+XFS tests I have been creating 8 20G files on an otherwise empty device. Discard is enabled when XFS is mounted. The device is a 1 TB Samsung 980 Pro, although I can repro this with a 512G Kingston SSD. After running the O_DIRECT+XFS tests I then create more 20G files to make the device almost (at least 95%) full and then I do the raw device tests. When tested this way I get more IOPs from O_DIRECT + XFS than from raw using the Beelink server as shown above.
Then I tried the following:
- Do mkfs.xfs on the Beelink for the Samsung 980 Pro, create 8 20G files, run fio to do random 4kb reads with O_DIRECT and I get ~400k IOPs at 32 threads and the average value for iostat's r_await is 70 microseconds.
- Create 37 more 20G files to make the device almost full and repeat the test from step 1, again just using the first 8 20G files and I get 360k IOPs at 32 threads and the average value for iostat's r_await is now 80 microseconds.
- Run the test for fio with a now almost full raw device and I get 370k IOPs at 32 threads.
- Drop those 37 20G files, wait 5 minutes and repeat the test. Now I get ~400k IOPs at 32 threads.
So I still don't understand this, but I will claim that fio+raw gets more IOPs than fio+O_DIRECT when the device is in the same state. The confusion comes from reporting numbers above where fio+raw was run on a full device but fio+O_DIRECT was not.
That makes my brain hurt. :-) Nice write-up.
ReplyDelete