For the results below I split the 42 microbenchmarks into 5 groups -- 2 for point queries, 2 for range queries, 1 for writes. For the range query microbenchmarks, part 1 has queries that don't do aggregation while part 2 has queries that do aggregation. The spreadsheet with all data and charts
is here. For each group I present a chart and a table with summary statistics for the three setups: 1u.1t, 4u.1t and 4u.4t.
All of the charts have relative throughput on the y-axis where that is (QPS for $me) / (QPS for $base), $me is some DBMS version (for example MariaDB 11.4.1) and $base is the DBMS version for the base case. The base version is specified below depending on what I am comparing. The y-axis doesn't start at 0 to improve readability. When the relative throughput is > 1 then the throughput on some DBMS version is greater than the throughput for the base case.
The legend under the x-axis truncates the names I use for the microbenchmarks and I don't know how to fix that other than sharing links (see above) to the Google Sheets I used.
Results: MariaDB from old to new
This section uses MariaDB 10.2.44 as the base version and then compares that with MariaDB versions 10.3.39, 10.4.33, 10.5.24, 10.6.17, 10.11.7 and 11.4.1. The goal is to determine how throughput (QPS) changes from older releases like 10.2 to the latest release (11.4).
These tables have summary statistics of the throughput for MariaDB 11.4.1 relative to 10.2.44 for each microbenchmark groups. A value greater than one means the throughput for MariaDB 11.4.1 is better than for 10.2.44. From the results here, new MariaDB (11.4.1) gets at least 92% with 1u.1t, at least 93% with 4u.1t and 92% with 4u.4t of the throughput relative to old MariaDB (10.2.44) using the median relative throughput per microbenchmark group. New features added to MariaDB don't get in the way of performance because there aren't significant regressions over time.
Summary statistics for 1u.1t
| point, part 1 | point, part 2 | range, part 1 | range, part 2 | writes |
| average | 0.98 | 0.98 | 0.98 | 0.96 | 0.92 |
| median | 0.99 | 0.99 | 0.94 | 0.94 | 0.92 |
| min | 0.89 | 0.93 | 0.93 | 0.90 | 0.81 |
| max | 1.03 | 1.03 | 1.17 | 1.04 | 1.00 |
| stddev | 0.04 | 0.04 | 0.08 | 0.06 | 0.05 |
Summary statistics for 4u.1t
| point, part 1 | point, part 2 | range, part 1 | range, part 2 | writes |
| average | 0.96 | 0.97 | 0.97 | 0.96 | 1.04 |
| median | 0.97 | 0.99 | 0.94 | 0.93 | 1.04 |
| min | 0.91 | 0.92 | 0.93 | 0.91 | 0.93 |
| max | 0.99 | 1.01 | 1.16 | 1.03 | 1.15 |
| stddev | 0.03 | 0.04 | 0.08 | 0.06 | 0.08 |
Summary statistics for 4u.4t
| point, part 1 | point, part 2 | range, part 1 | range, part 2 | writes |
| average | 0.97 | 0.96 | 0.96 | 0.94 | 1.00 |
| median | 0.97 | 0.99 | 0.92 | 0.92 | 1.00 |
| min | 0.91 | 0.91 | 0.90 | 0.90 | 0.77 |
| max | 1.00 | 0.99 | 1.14 | 1.00 | 1.16 |
| stddev | 0.03 | 0.04 | 0.08 | 0.05 | 0.13 |
There are three graphs per microbenchmark group - for 1u.1t, 4u.1t and 4u.4t. The y-axis doesn't begin at zero to improve readability.
Graphs for point queries, part 1. Results are similar across 1u.1t, 4u.1t and 4u.4t.
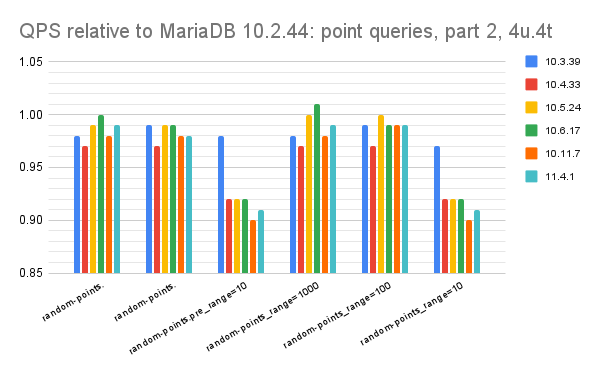
Graphs for point queries, part 2. Results are similar across 1u.1t, 4u.1t and 4u.4t.
Graphs for range queries, part 1. Results are similar across 1u.1t, 4u.1t and 4u.4t. Full table scan gets much faster in modern MariaDB as it does in modern MySQL.
Graphs for range queries, part 2. Results are similar across 1u.1t, 4u.1t and 4u.4t.
Graphs for writes. Results are similar across 1u.1t, 4u.1t and 4u.4t. Modern MariaDB is much faster at the update-index microbenchmark for 4u.1t and 4u.4t, which is similar to what happens with MySQL although the improvements for MySQL are larger. Alas, the speedup in update-index decreases from MariaDB 10.5 through 11.4 as it does for most of the microbenchmarks. That decrease is not visible for the read-heavy microbenchmarks above.


Results: MySQL from old to new
This section uses MySQL 5.6.51 as the base version and then compares that with MySQL versions 5.7.44 and 8.0.36. The goal is to determine how throughput (QPS) changes from older to newer releases.
These tables have summary statistics of the throughput for MySQL 8.0.36 vs 5.6.51 for each of the microbenchmark groups. A value greater than one means the throughput for MySQL 8.0.36 is better than for 5.6.51. From the results here, new MySQL (8.0.36) gets between 66% and 84% of the throughput relative to old MySQL (5.6.51) using the median relative throughput per microbenchmark group. New features in modern MySQL come at the cost of much CPU overhead.
Summary statistics for 1u.1t
| point, part 1 | point, part 2 | range, part 1 | range, part 2 | writes |
| average | 0.71 | 0.75 | 0.69 | 0.86 | 0.68 |
| median | 0.71 | 0.72 | 0.69 | 0.81 | 0.66 |
| min | 0.66 | 0.69 | 0.67 | 0.73 | 0.55 |
| max | 0.76 | 0.84 | 0.71 | 1.03 | 0.90 |
| stddev | 0.03 | 0.07 | 0.01 | 0.14 | 0.11 |
Summary statistics for 4u.1t
| point, part 1 | point, part 2 | range, part 1 | range, part 2 | writes |
| average | 0.72 | 0.75 | 0.68 | 0.87 | 1.07 |
| median | 0.72 | 0.72 | 0.68 | 0.82 | 0.82 |
| min | 0.67 | 0.69 | 0.67 | 0.74 | 0.58 |
| max | 0.77 | 0.84 | 0.69 | 1.04 | 3.59 |
| stddev | 0.03 | 0.07 | 0.01 | 0.14 | 0.90 |
Summary statistics for 4u.4t
| point, part 1 | point, part 2 | range, part 1 | range, part 2 | writes |
| average | 0.72 | 0.76 | 0.68 | 0.88 | 0.83 |
| median | 0.72 | 0.72 | 0.69 | 0.84 | 0.81 |
| min | 0.68 | 0.70 | 0.67 | 0.76 | 0.65 |
| max | 0.78 | 0.85 | 0.70 | 1.04 | 1.08 |
| stddev | 0.03 | 0.07 | 0.01 | 0.13 | 0.13 |
There are three graphs per microbenchmark group - for 1u.1t, 4u.1t and 4u.4t. The y-axis doesn't begin at zero to improve readability.
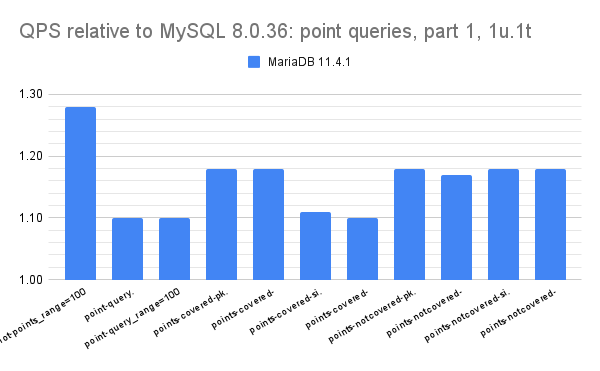
Graphs for point queries, part 1. Results are similar across 1u.1t, 4u.1t and 4u.4t. There are large regressions from 5.6 to 5.7 and then again from 5.7 to 8.0.
Graphs for point queries, part 2. Results are similar across 1u.1t, 4u.1t and 4u.4t. There are large regressions from 5.6 to 5.7 and then again from 5.7 to 8.0.
Graphs for range queries, part 1. Results are similar across 1u.1t, 4u.1t and 4u.4t. There are large regressions from 5.6 to 5.7 and then again from 5.7 to 8.0.
Graphs for range queries, part 2. Results are similar across 1u.1t, 4u.1t and 4u.4t. There are large regressions from 5.6 to 5.7 and then again from 5.7 to 8.0.
Graphs for writes. Results are mostly similar across 1u.1t, 4u.1t and 4u.4t with one exception. For the update-index microbenchmark the graphs truncate the relative throughput value for update-index because MySQL 5.7 and 8.0 are much faster than 5.6. The values are in
the spreadsheet and the relative throughput for 4u.1t is (2.49, 3.59) for (5.7, 8.0) and for 4u.4t is (1.45, 1.08) for (5.7, 8.0). So the improvement is larger for 4u.1t than for 4u.4t which suggests something was done to greatly reduce contention on that microbenchmark.
Results: MariaDB vs MySQL
This section uses MySQL 8.0.36 as the base version and then compares that with MariaDB 11.4.1. The goal is to determine which DBMS gets more throughput (or uses less CPU/query).
These tables have summary statistics of the throughput for MariaDB 11.4.1 vs MySQL 8.0.36 for each of the microbenchmark groups. A value greater than one means the throughput for MariaDB 11.4.1 is better than for MySQL 8.0.36. From the results here, modern MariaDB (11.4.1) gets between 111% and 123% of the throughput relative to modern MySQL (8.0.36) using the median relative throughput per microbenchmark group. Modern MariaDB is faster than modern MySQL (on this setup) because MySQL has more performance regressions over time.
There is one outlier from the update-index microbenchmark. For update-index, modern MySQL is faster than modern MariaDB because MySQL 5.7 and 8.0 are much faster than MySQL 5.6, especially in the 4u.1t setup where there is more contention. But the performance for modern MariaDB didn't improve as much as it did for modern MySQL. The result is that modern MySQL is up to 3X faster than modern MariaDB for update-index.
Summary statistics for 1u.1t
| point, part 1 | point, part 2 | range, part 1 | range, part 2 | writes |
| average | 1.16 | 1.17 | 1.18 | 1.17 | 1.21 |
| median | 1.18 | 1.18 | 1.18 | 1.11 | 1.23 |
| min | 1.10 | 1.12 | 1.11 | 1.09 | 1.06 |
| max | 1.28 | 1.20 | 1.37 | 1.30 | 1.30 |
| stddev | 0.05 | 0.03 | 0.08 | 0.10 | 0.08 |
Summary statistics for 4u.1t
| point, part 1 | point, part 2 | range, part 1 | range, part 2 | writes |
| average | 1.15 | 1.18 | 1.18 | 1.18 | 1.15 |
| median | 1.15 | 1.20 | 1.18 | 1.13 | 1.18 |
| min | 1.06 | 1.13 | 1.11 | 1.12 | 0.35 |
| max | 1.23 | 1.23 | 1.37 | 1.30 | 1.60 |
| stddev | 0.05 | 0.04 | 0.08 | 0.09 | 0.32 |
Summary statistics for 4u.4t
| point, part 1 | point, part 2 | range, part 1 | range, part 2 | writes |
| average | 1.15 | 1.17 | 1.16 | 1.16 | 1.14 |
| median | 1.15 | 1.19 | 1.17 | 1.11 | 1.16 |
| min | 1.08 | 1.11 | 1.07 | 1.09 | 0.92 |
| max | 1.27 | 1.20 | 1.33 | 1.27 | 1.31 |
| stddev | 0.06 | 0.04 | 0.08 | 0.09 | 0.11 |
There are three graphs per microbenchmark group - for 1u.1t, 4u.1t and 4u.4t. The y-axis doesn't begin at zero to improve readability.
Graphs for point queries, part 1. Results are similar across 1u.1t, 4u.1t and 4u.4t. And modern MariaDB is faster than modern MySQL in all of the microbenchmarks.
Graphs for point queries, part 2. Results are similar across 1u.1t, 4u.1t and 4u.4t. And modern MariaDB is faster than modern MySQL in all of the microbenchmarks.
Graphs for range queries, part 1. Results are similar across 1u.1t, 4u.1t and 4u.4t. And modern MariaDB is faster than modern MySQL in all of the microbenchmarks.
Graphs for range queries, part 2. Results are similar across 1u.1t, 4u.1t and 4u.4t. And modern MariaDB is faster than modern MySQL in all of the microbenchmarks.
Graphs for writes. Results are similar across 1u.1t, 4u.1t and 4u.4t. And modern MariaDB is faster than modern MySQL in all of the microbenchmarks except for update-index with 4u.1t and 4u.4t. The reason is that both modern MariaDB and modern MySQL have gotten faster on that microbenchmark but the improvement for MySQL is larger.


No comments:
Post a Comment