This has results from the sysbench benchmark for many versions of Postgres on a small server with a cached and low-concurrency workload. This work was done by Small Datum LLC.
My standard disclaimer is that sysbench with low-concurrency is great for spotting CPU regressions. However, a result with higher concurrency from a larger server is also needed to understand things. Results from IO-bound workloads and less synthetic workloads are also needed. But low-concurrency, cached sysbench is a great place to start.
tl;dr
- Postgres 17beta1 has no regressions and several improvements.
- Postgres 17beta1 looks great as the median throughput is between 1% and 17% better than Postgres 10.23, excluding the hot-points microbenchmark which is ~2X faster
- One of the microbenchmarks (hot-points) gets ~2X more QPS than previous Postgres releases. The result is so good that I don't trust it yet but I wonder if this is from a change by Peter Geoghegan. From vmstat, 17beta1 cuts the CPU time in half for that query. The 17beta1 release notes state there are changes to improve queries with a large in-list so I believe the 2X speedup here is not a bug
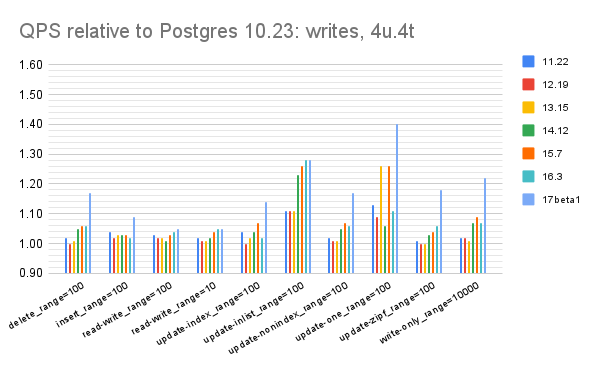
- There are big improvements in 17beta1 for several of the microbenchmarks that do writes
Other interesting changes:
- This patch might explain some improvements for range queries
Builds and configuration
I tested Postgres versions 10.23, 11.22, 12.19, 13.15, 14.12, 15.7, 16.3 and 17beta1. Everything was compiled from source. The config files are here.
Benchmarks
I used sysbench and my usage is explained here. There are 42 microbenchmarks and most test only 1 type of SQL statement.
Tests were run on my newest small server, an ASUS PN53 with 8 cores, 32G of RAM, an NVMe SSD with XFS and Ubuntu 22.04. The server is described here.
The benchmark is run 3 setups.
- 1u.1t - 1 connection, 1 table with 50M rows
- 4u.1t - 4 connections, 1 table with 50M rows
- 4u.4t - 4 connections, 4 tables with 48M rows (12M per table)
In all cases
- each microbenchmark runs for 300 seconds if read-only and 600 seconds otherwise
- prepared statements were enabled
The command lines for my helper scripts were:
bash r.sh 1 50000000 300 600 nvme1n1 1 1 1
bash r.sh 1 50000000 300 600 nvme1n1 1 1 4
bash r.sh 4 12000000 300 600 nvme1n1 1 1 4
Results
For the results below I split the 42 microbenchmarks into 5 groups -- 2 for point queries, 2 for range queries, 1 for writes. For the range query microbenchmarks, part 1 has queries that don't do aggregation while part 2 has queries that do aggregation. The spreadsheet with all data and charts is here. For each group I present a chart and a table with summary statistics for the three setups: 1u.1t, 4u.1t and 4u.4t.
All of the charts have relative throughput on the y-axis where that is (QPS for $me) / (QPS for $base), $me is some DBMS version (for example Postgres 16.3) and $base is Postgres 10.23. The y-axis doesn't start at 0 to improve readability. When the relative throughput is > 1 then that version is faster than the base case.
The legend under the x-axis truncates the names I use for the microbenchmarks and I don't know how to fix that other than sharing links (see above) to the Google Sheets I used.
Summary statistics
This section presents summary statistics of the throughput from Postgres 17beta1 relative to 10.23 for each microbenchmark group. A value greater than one means that 17beta1 gets more throughput than 10.23 which is good news. And there is much good news in the results below. The most extreme good news is the result from the hot-points microbenchmark where 17beta1 gets ~2X more QPS than previous versions. But that result should be explained before I trust it.
Stats for 1u.1t
Stats for 4u.1t
Stats for 4u.4t
Graphs
There are three graphs per microbenchmark group - one for each of 1u.1t, 4u.1t and 4u.4t. The y-axis doesn't begin at zero to improve readability.
Graphs for point queries, part 1. Results are similar across 1u.1t, 4u.1t and 4u.4t. The line for hot points (the left-most group) is truncated for 17beta1 because the value is ~2 and I want to focus on readability for results close to 1.
Graphs for range queries, part 1.
Graphs for range queries, part 2.
Graphs for writes. The y-axis goes to 1.6 because there are a few large improvements in 17beta1. While that makes some of the lines that end near 1.0 harder to read, this is a good problem to have.


No comments:
Post a Comment