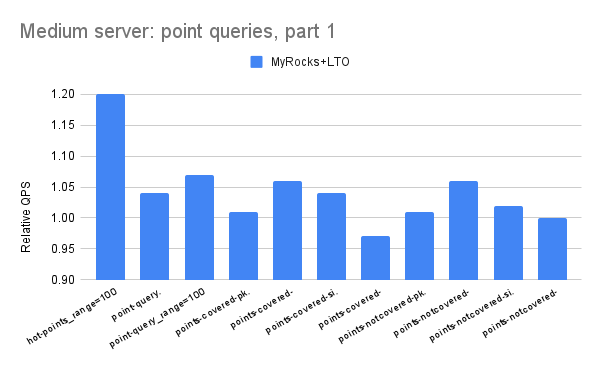
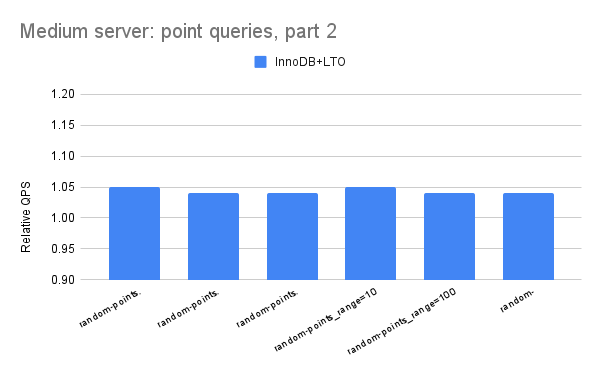
This post has results to show the benefit from using link time optimization for MySQL. That is enabled via the CMake option -DWITH_LTO=ON.
tl;dr
- A typical improvement is ~5% more QPS from link time optimization
- On the small servers (PN53, SER4) the benefit from link-time optimization was larger for InnoDB than for MyRocks. On the medium server (C2D) the benefit was similar for MyRocks and InnoDB.
Builds
I used InnoDB from MySQL 8.0.37 and MyRocks from FB MySQL compiled on git sha 65644b82c which uses RocksDB 9.3.1 and was latest as of June 12, 2024. The compiler was gcc 11.4.0.
Hardware
I tested on three servers:
- SER4 - Beelink SER 4700u (see here) with 8 cores and a Ryzen 7 4700u CPU
- PN53 - ASUS ExpertCenter PN53 (see here) with 8 cores and an AMD Ryzen 7 7735HS CPU
- C2D - a c2d-highcpu-32 instance type on GCP (c2d high-CPU) with 32 vCPU and SMT disabled so there are 16 cores
Benchmark
I used sysbench and my usage is explained here. There are 42 microbenchmarks and most test only 1 type of SQL statement. The database is cached by MyRocks and InnoDB.
The benchmark is run with:
- SER4, PN53 - 1 thread, 1 table and 30M rows
- C2D - 12 threads, 8 tables and 10M rows per table
- each microbenchmark runs for 300 seconds if read-only and 600 seconds otherwise
- prepared statements were enabled
The command lines for my helper scripts were:
# PN53, SER4
bash r.sh 1 30000000 300 600 nvme0n1 1 1 1
# C2D
bash r.sh 8 10000000 300 600 md0 1 1 12
Results
For the results below I split the 42 microbenchmarks into 5 groups -- 2 for point queries, 2 for range queries, 1 for writes. For the range query microbenchmarks, part 1 has queries that don't do aggregation while part 2 has queries that do aggregation. The spreadsheet with all data and charts is here. For each group I present a chart and a table with summary statistics.
All of the charts have relative throughput on the y-axis where that is (QPS with LTO) / (QPS without LTO) and with LTO means link-time optimization was enabled. The y-axis doesn't start at 0 to improve readability. When the relative throughput is > 1 then that version of MySQL with link-time optimization is faster.
The legend under the x-axis truncates the names I use for the microbenchmarks and I don't know how to fix that other than sharing links (see above) to the Google Sheets I used.
Results: SER4
Summary statistics for MyRocks
Summary statistics for InnoDB
There are two charts per section -- the first for MyRocks, the second for InnoDB.
Point queries, part 1
Point queries, part 2
Range queries, part 1
Range queries, part 2
Writes
Results: PN53
Summary statistics for MyRocks
Summary statistics for InnoDB
There are two charts per section -- the first for MyRocks, the second for InnoDB.
Results: C2D
_%20point%20queries,%20part%201.png)
_%20point%20queries,%20part%201.png)
_%20point%20queries,%20part%202.png)
_%20point%20queries,%20part%202.png)
_%20range%20queries,%20part%201.png)
_%20range%20queries,%20part%201.png)
_%20range%20queries,%20part%202.png)
_%20range%20queries,%20part%202.png)
_%20writes.png)
_%20writes.png)
_%20point%20queries,%20part%201.png)
_%20point%20queries,%20part%201.png)
_%20point%20queries,%20part%202.png)
_%20point%20queries,%20part%202.png)
_%20range%20queries,%20part%201.png)
_%20range%20queries,%20part%201.png)
_%20range%20queries,%20part%202.png)
_%20range%20queries,%20part%202.png)
_%20writes.png)
_%20writes.png)


No comments:
Post a Comment