Friday, May 24, 2024

Sysbench on a new small server: MariaDB vs MySQL

This has results from the sysbench benchmark for MariaDB and MySQL on a new, small server with a cached and low-concurrency workload. For MariaDB I tested LTS releases from 10.2 through 11.4. For MySQL I tested 5.6, 5.7 and 8.0. The results from MySQL here are a good reason to use changepoint detection to spot regressions early, like that provided by Nyrkiƶ.

This work was done by Small Datum LLC and sponsored by the MariaDB Foundation. Previous posts shared results from older, small servers: here and here. The results here are similar.

My standard disclaimer is that sysbench with low-concurrency is great for spotting CPU regressions. However, a result with higher concurrency from a larger server is also needed to understand things. Results from IO-bound workloads and less synthetic workloads are also needed. But low-concurrency, cached sysbench is a great place to start.

tl;dr

  • MySQL suffers more from performance regressions than MariaDB
  • Modern MariaDB is 10% to 30% faster than modern MySQL on most microbenchmarks
  • The update-index microbenchmark is an exception to the MariaDB is faster result because throughput there for modern MySQL improved a lot more than it did for modern MariaDB

Builds and configuration

For MariaDB I used the latest point releases from LTS versions: 10.2.44, 10.3.39, 10.4.33, 10.5.24, 10.6.17, 10.11.7 and the upcoming LTS 11.4.1. 

For MySQL I used 5.6.51, 5.7.44 and 8.0.36.

The first GA release for MariaDB 10.2 was in 2017. The first GA release for MySQL 5.6 was in 2013. So while I cannot claim that my testing covers MySQL and MariaDB from the same time period, I can claim that I am testing old versions of both.

Everything was compiled from source with similar CMake command lines and CMAKE_BUILD_TYPE set to Release. It is much easier to compile older MariaDB releases than older MySQL releases. For MariaDB I did not have to edit any source files. Notes on compiling MySQL are here for 5.6, for 5.6 and 5.7, for 5.7 and for 8.0. A note on using cmake is here.

The my.cnf files are here.

Benchmarks

I used sysbench and my usage is explained here. There are 42 microbenchmarks and most test only 1 type of SQL statement.

Tests were run on my newest small server, an ASUS PN53 with 8 cores, 32G of RAM, an NVMe SSD with XFS and Ubuntu 22.04. The server is described here.

The benchmark is run 3 setups. Some of the microbenchmarks suffer from contention and that is worse with 4u.1t than 4u.4t:
  • 1u.1t - 1 connection, 1 table with 50M rows
  • 4u.1t - 4 connections, 1 table with 50M rows
  • 4u.4t - 4 connections, 4 tables with 48M rows (12M per table)
In all cases
  • each microbenchmark runs for 300 seconds if read-only and 600 seconds otherwise
  • prepared statements were enabled
The command lines for my helper scripts were:

bash r.sh 1 50000000 300 600 nvme1n1 1 1 1
bash r.sh 1 50000000 300 600 nvme1n1 1 1 4
bash r.sh 4 12000000 300 600 nvme1n1 1 1 4

Results

For the results below I split the 42 microbenchmarks into 5 groups -- 2 for point queries, 2 for range queries, 1 for writes. For the range query microbenchmarks, part 1 has queries that don't do aggregation while part 2 has queries that do aggregation. The spreadsheet with all data and charts is here. For each group I present a chart and a table with summary statistics for the three setups: 1u.1t, 4u.1t and 4u.4t.

All of the charts have relative throughput on the y-axis where that is (QPS for $me) / (QPS for $base), $me is some DBMS version (for example MariaDB 11.4.1) and $base is the DBMS version for the base case. The base version is specified below depending on what I am comparing. The y-axis doesn't start at 0 to improve readability. When the relative throughput is > 1 then the throughput on some DBMS version is greater than the throughput for the base case.

The legend under the x-axis truncates the names I use for the microbenchmarks and I don't know how to fix that other than sharing links (see above) to the Google Sheets I used.

Results: MariaDB from old to new

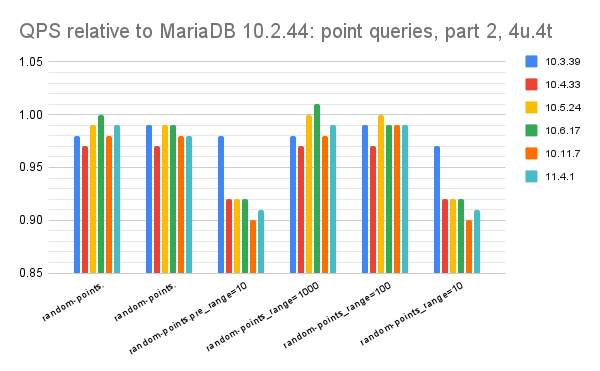
This section uses MariaDB 10.2.44 as the base version and then compares that with MariaDB versions 10.3.39, 10.4.33, 10.5.24, 10.6.17, 10.11.7 and 11.4.1. The goal is to determine how throughput (QPS) changes from older releases like 10.2 to the latest release (11.4). 

These tables have summary statistics of the throughput for MariaDB 11.4.1 relative to 10.2.44 for each microbenchmark groups. A value greater than one means the throughput for MariaDB 11.4.1 is better than for 10.2.44. From the results here, new MariaDB (11.4.1) gets at least 92% with 1u.1t, at least 93% with 4u.1t and 92% with 4u.4t of the throughput relative to old MariaDB (10.2.44) using the median relative throughput per microbenchmark group. New features added to MariaDB don't get in the way of performance because there aren't significant regressions over time.

Summary statistics for 1u.1t

point, part 1point, part 2range, part 1range, part 2writes
average0.980.980.980.960.92
median0.990.990.940.940.92
min0.890.930.930.900.81
max1.031.031.171.041.00
stddev0.040.040.080.060.05

Summary statistics for 4u.1t

point, part 1point, part 2range, part 1range, part 2writes
average0.960.970.970.961.04
median0.970.990.940.931.04
min0.910.920.930.910.93
max0.991.011.161.031.15
stddev0.030.040.080.060.08

Summary statistics for 4u.4t

point, part 1point, part 2range, part 1range, part 2writes
average0.970.960.960.941.00
median0.970.990.920.921.00
min0.910.910.900.900.77
max1.000.991.141.001.16
stddev0.030.040.080.050.13

There are three graphs per microbenchmark group - for 1u.1t, 4u.1t and 4u.4t. The y-axis doesn't begin at zero to improve readability.

Graphs for point queries, part 1. Results are similar across 1u.1t, 4u.1t and 4u.4t.  
Graphs for point queries, part 2. Results are similar across 1u.1t, 4u.1t and 4u.4t. 
Graphs for range queries, part 1. Results are similar across 1u.1t, 4u.1t and 4u.4t. Full table scan gets much faster in modern MariaDB as it does in modern MySQL.
Graphs for range queries, part 2. Results are similar across 1u.1t, 4u.1t and 4u.4t. 

Graphs for writes. Results are similar across 1u.1t, 4u.1t and 4u.4t. Modern MariaDB is much faster at the update-index microbenchmark for 4u.1t and 4u.4t, which is similar to what happens with MySQL although the improvements for MySQL are larger. Alas, the speedup in update-index decreases from MariaDB 10.5 through 11.4 as it does for most of the microbenchmarks. That decrease is not visible for the read-heavy microbenchmarks above.

Results: MySQL from old to new

This section uses MySQL 5.6.51 as the base version and then compares that with MySQL versions 5.7.44 and 8.0.36. The goal is to determine how throughput (QPS) changes from older to newer releases. 

These tables have summary statistics of the throughput for MySQL 8.0.36 vs 5.6.51 for each of the microbenchmark groups. A value greater than one means the throughput for MySQL 8.0.36 is better than for 5.6.51. From the results here, new MySQL (8.0.36) gets between 66% and 84% of the throughput relative to old MySQL (5.6.51) using the median relative throughput per microbenchmark group. New features in modern MySQL come at the cost of much CPU overhead.

Summary statistics for 1u.1t

point, part 1point, part 2range, part 1range, part 2writes
average0.710.750.690.860.68
median0.710.720.690.810.66
min0.660.690.670.730.55
max0.760.840.711.030.90
stddev0.030.070.010.140.11

Summary statistics for 4u.1t

point, part 1point, part 2range, part 1range, part 2writes
average0.720.750.680.871.07
median0.720.720.680.820.82
min0.670.690.670.740.58
max0.770.840.691.043.59
stddev0.030.070.010.140.90

Summary statistics for 4u.4t

point, part 1point, part 2range, part 1range, part 2writes
average0.720.760.680.880.83
median0.720.720.690.840.81
min0.680.700.670.760.65
max0.780.850.701.041.08
stddev0.030.070.010.130.13

There are three graphs per microbenchmark group - for 1u.1t, 4u.1t and 4u.4t. The y-axis doesn't begin at zero to improve readability.

Graphs for point queries, part 1. Results are similar across 1u.1t, 4u.1t and 4u.4t.  There are large regressions from 5.6 to 5.7 and then again from 5.7 to 8.0.
Graphs for point queries, part 2. Results are similar across 1u.1t, 4u.1t and 4u.4t.  There are large regressions from 5.6 to 5.7 and then again from 5.7 to 8.0.
Graphs for range queries, part 1. Results are similar across 1u.1t, 4u.1t and 4u.4t.  There are large regressions from 5.6 to 5.7 and then again from 5.7 to 8.0.
Graphs for range queries, part 2. Results are similar across 1u.1t, 4u.1t and 4u.4t.  There are large regressions from 5.6 to 5.7 and then again from 5.7 to 8.0.
Graphs for writes. Results are mostly similar across 1u.1t, 4u.1t and 4u.4t with one exception. For the update-index microbenchmark the graphs truncate the relative throughput value for update-index because MySQL 5.7 and 8.0 are much faster than 5.6. The values are in the spreadsheet and the relative throughput for 4u.1t is (2.49, 3.59) for (5.7, 8.0) and for 4u.4t is (1.45, 1.08) for (5.7, 8.0). So the improvement is larger for 4u.1t than for 4u.4t which suggests something was done to greatly reduce contention on that microbenchmark.
Results: MariaDB vs MySQL

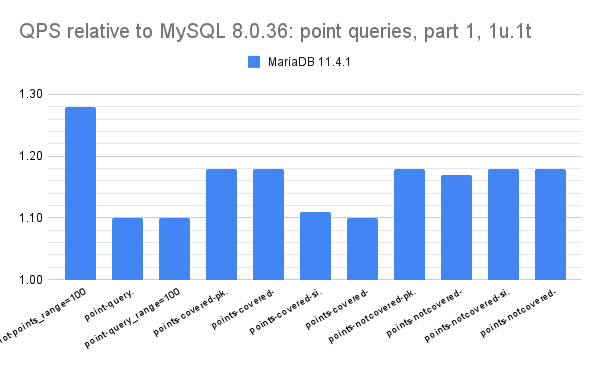
This section uses MySQL 8.0.36 as the base version and then compares that with MariaDB 11.4.1. The goal is to determine which DBMS gets more throughput (or uses less CPU/query).

These tables have summary statistics of the throughput for MariaDB 11.4.1 vs MySQL 8.0.36 for each of the microbenchmark groups. A value greater than one means the throughput for MariaDB 11.4.1 is better than for MySQL 8.0.36. From the results here, modern MariaDB (11.4.1) gets between 111% and 123% of the throughput relative to modern MySQL (8.0.36) using the median relative throughput per microbenchmark group. Modern MariaDB is faster than modern MySQL (on this setup) because MySQL has more performance regressions over time.

There is one outlier from the update-index microbenchmark. For update-index, modern MySQL is faster than modern MariaDB because MySQL 5.7 and 8.0 are much faster than MySQL 5.6, especially in the 4u.1t setup where there is more contention. But the performance for modern MariaDB didn't improve as much as it did for modern MySQL. The result is that modern MySQL is up to 3X faster than modern MariaDB for update-index.

Summary statistics for 1u.1t

point, part 1point, part 2range, part 1range, part 2writes
average1.161.171.181.171.21
median1.181.181.181.111.23
min1.101.121.111.091.06
max1.281.201.371.301.30
stddev0.050.030.080.100.08

Summary statistics for 4u.1t

point, part 1point, part 2range, part 1range, part 2writes
average1.151.181.181.181.15
median1.151.201.181.131.18
min1.061.131.111.120.35
max1.231.231.371.301.60
stddev0.050.040.080.090.32

Summary statistics for 4u.4t

point, part 1point, part 2range, part 1range, part 2writes
average1.151.171.161.161.14
median1.151.191.171.111.16
min1.081.111.071.090.92
max1.271.201.331.271.31
stddev0.060.040.080.090.11

There are three graphs per microbenchmark group - for 1u.1t, 4u.1t and 4u.4t. The y-axis doesn't begin at zero to improve readability.

Graphs for point queries, part 1. Results are similar across 1u.1t, 4u.1t and 4u.4t. And modern MariaDB is faster than modern MySQL in all of the microbenchmarks. 
Graphs for point queries, part 2. Results are similar across 1u.1t, 4u.1t and 4u.4t. And modern MariaDB is faster than modern MySQL in all of the microbenchmarks.
Graphs for range queries, part 1. Results are similar across 1u.1t, 4u.1t and 4u.4t. And modern MariaDB is faster than modern MySQL in all of the microbenchmarks.
Graphs for range queries, part 2. Results are similar across 1u.1t, 4u.1t and 4u.4t. And modern MariaDB is faster than modern MySQL in all of the microbenchmarks.

Graphs for writes. Results are similar across 1u.1t, 4u.1t and 4u.4t. And modern MariaDB is faster than modern MySQL in all of the microbenchmarks except for update-index with 4u.1t and 4u.4t. The reason is that both modern MariaDB and modern MySQL have gotten faster on that microbenchmark but the improvement for MySQL is larger.


Thursday, May 23, 2024

Space vs CPU tradeoffs with universal compaction in RocksDB

This post explains the impact of compression for write-heavy workloads with universal compaction in RocksDB. With an LSM you can spend on CPU to save on space. For leveled compaction I normally use no compression for L0, L1 and L2 because compressing them has a small impact on space but costs a lot in CPU and write stalls. My advice for universal compaction is similar -- don't compress everything.

tl;dr

  • For fillseq (load in key order) the insert rates are better with less compression, so no compression beats LZ4 and LZ4 beats ZSTD because with stronger compression there are more write stalls. But for overwrite the insert rate is similar regardless of compression for reasons I haven't fully explained.
  • There is more CPU used by compaction when there is more compression. The difference in CPU overhead can exceed 3X when comparing no compression (m1.none) and ZSTD for everything (m1.zstd).
  • There is less write-amp when there is more compression because with a smaller database there is less to write.

Workload

I used a hacked version of my db_bench helper scripts to run the fillseq and overwrite benchmark steps on a small server (see v5 here, Beelink SER7 with 8 cores, Ryzen7 CPU, 32G RAM, m.2 storage, Ubuntu 22.04 and XFS).

Note that db_bench was configured to generate values that can compress in half, thus the numbers below show that an uncompressed database can be ~2X larger than a compressed database.

The sequence of benchmark steps is below. I look at performance results for fillseq and overwriteandwait. The command lines are here for the m1, 80 and 90 config groups.

  • fillseq - load 100M KV pairs in key order
  • overwritesome - overwrite 10M KV pairs to fragment the LSM tree
  • waitforcompaction - wait for compaction to finish so that all configs start from a similar state for the next benchmark step
  • overwriteandwait - overwrite keys as fast as possible for 20 minutes

There were 3 types of configurations that I call m1, 80 and 90 below. They differ in the value used with --universal_compression_size_percent. The configs set it to -1, 80 and 90 for the m1, 80 and 90 configuration types. 

  • m1 - all SSTs are either compressed or not compressed (see below)
  • 80 - 80% of the SSTs are compressed, the 20% smallest (newest) are not compressed.
  • 90 - 90% of the SSTs are compressed, the 90% smallest (newest) are not compressed

Then within each configuration type I try a mix of no, lz4 and zstd compression. The configs descriped with except the largest sorted run get that by setting bottommost_compression. The full set of configs tested are:

  • m1.none
    • nothing is compressed
  • m1.lz4
    • uses LZ4 compression for all SSTs
  • m1.zstd
    • uses ZSTD compression for all SSTs
  • m1.lz
    • uses LZ4 compression for all SSTs except the largest sorted run which uses ZSTD
  • 80.none
    • nothing is compressed, just like m1.none
  • 80.lz4
    • uses LZ4 to compress the largest (oldest) 80% of the SSTs
  • 80.zstd
    • uses ZSTD for the largest (oldest) 80% of the SSTs
  • 90.nnl
    • uses LZ4 for the largest sorted run and no compression elsewhere
  • 90.nnz
    • uses ZSTD for the largest sorted run and no compression elsewhere
  • 90.nlz
    • uses ZSTD for the largest sorted run, LZ4 for ~90% of the next largest SSTs and then no compression for everything else (the newest, smallest SSTs)

Results

Legend for the tables below:

  • config
    • name of the tested configuration and the values are explained above
  • ips
    • the average rate for inserts/s
  • stall%
    • percentage of time for which there are write stalls. Note that tests are run with fsync on commit disabled which can make write stalls more likely
  • w_amp
    • write amplification. Without compression the minimum should be 2 (write once to WAL, once to L0 on memtable flush) but with compression it can be less.
  • c_wsecs
    • wall-clock seconds doing compaction
  • c_csecs
    • CPU seconds doing compaction. In some cases this is larger than c_wsecs because subcompactions were enabled (set to 2) and one compaction job can use 2 threads.
  • sizeGB
    • size in GB of the database. For fillseq this is the total database size but for overwriteandwait it is only the size of the largest sorted run (which was stored in L39) because there is too much variance on the total database size with universal compaction for benchmark steps other than fillseq.
Results from the fillseq benchmark step that does inserts in key order. I use green to indicate the best results from each column and red for the worst. All of the results are here.

  • The insert rates are better with less compression, so no beats LZ4 and LZ4 beats ZSTD. 
  • With more compression there are more write stalls.
  • There is more CPU used by compaction when there is more compression. The difference in CPU overhead is larger than 3X when comparing no compression (m1.none) and ZSTD for everything (m1.zstd).
  • There is less write-amp when there is more compression because with a smaller database there is less to write.

configipsstall%w_ampc_wsecsc_csecssizeGB
m1.none112411744.02.0837139.9
m1.lz483473957.81.111410521.9
m1.zstd40128278.20.924423618.0
m1.lz81853457.81.111610821.9
80.none99501150.22.0897039.9
80.lz482089957.81.111410321.9
80.zstd39917178.20.924523618.0
90.nnl101072349.32.0927739.9
90.nnz101031849.12.0927739.9
90.nlz80805858.51.111810921.9

Results from the overwriteandwait benchmark step. I use green to indicate the best results from each column and red for the worst.

  • All configs provide a similar insert rate because there isn't a large difference in write stall percentage between the configs that use more compression and the configs that use less. The benchmark client uses more CPU per request here than for fillseq because key generation here uses a RNG while above it just increments a counter. Were I able to test something that sustains a higher request rate there might be differences here similar to what I see with fillseq.
  • There is a large difference in CPU overhead between configs that use less compression and configs that use more. But this CPU overhead is consumed by background threads that do compaction so it doesn't change the insert rate.
  • There is less write-amp when there is more compression because with a smaller database there is less to write.

configipsstall%w_ampc_wsecsc_csecssizeGB
m1.none3074770.66.91880123240.0
m1.lz43122200.13.71797191521.6
m1.zstd3006342.23.14565530717.8
m1.lz3124760.13.82776354917.8
80.none3071140.56.91864121940.0
80.lz43088540.15.91733162021.6
80.zstd3107170.15.62451265617.8
90.nnl3078810.46.92061190021.6
90.nnz3107310.26.22431279317.8
90.nlz3087930.25.72470299617.8


Tuesday, May 14, 2024

The Insert Benchmark: MariaDB, MySQL, new small server, cached workload, some concurrency

This post has results for the Insert Benchmark on a small server with a cached workload. The goal is to compare MariaDB and MySQL and see whether they get better or worse over time. The results here are from the newest small servers in my test cluster -- an ASUS PN53.

This work was done by Small Datum LLC and sponsored by the MariaDB Foundation.

The workload here has low concurrency (1 or 4 clients) and the database is cached. The results might be different when the workload is IO-bound or has more concurrency. Results were recently shared from tests run on an older small server. 

tl;dr

  • Modern MariaDB (11.4.1) is faster than modern MySQL (8.0.36) on all benchmark steps. MariaDB is almost 2X faster in the worst case for MySQL.
  • MariaDB 11.4.1 compared to 10.2.44 is up to 11% slower on the intiial load (l.i0), up to 26% faster on the write heavy steps (l.i1, l.i2) and up to 9% slower on the read-write steps (qr*, qp*). It has done a great job at avoiding regressions.
  • There are large regressions from MySQL 5.6.51 to 5.7.44 and then again from 5.7.44 to 8.0.36. In the worst case 5.6.51 is almost 2X faster than 8.0.36 and in most cases 8.0.36 is 15% to 30% slower than 5.6.51. 
Build + Configuration

This report has results for InnoDB from:
  • MySQL - versions 5.6.51, 5.7.44 and 8.0.36
  • MariaDB - versions 10.2.44, 10.3.39, 10.4.33, 10.5.24, 10.6.17, 10.11.7, 11.4.1. Versions 10.2, 10.3, 10.4, 10.5, 10.6 and 10.11 are the most recent LTS releases and 11.4 will be the next LTS release.
All of the my.cnf files are here. I tried to use similar configurations across releases, but isn't always possible. And even when it was possible I favor setting fewer entries especially for options where the default value changes between releases. The my.cnf files for MariaDB and MySQL can be split into two groups:
  • my.cnf.cz11a_c8r32 and my.cnf.cz11b_c8r32
    • these use innodb_purge_threads=4
    • the cz11a[pur1]_c8r32 versions use innodb_flush_method =O_DIRECT_NO_FSYNC while the cz11b[pur1]_c8r32 versions use =O_DIRECT (or its equivalent). All DBMS versions support cz11a_c8r32 except for MariaDB 11.4.1 which removed support for O_DIRECT_NO_FSYNC and uses the equivalent of O_DIRECT.
  • my.cnf.cz11apur1_c8r32 and my.cnf.cz11bpur1_c8r32
    • these use innodb_purge_threads=1 because on some of the older small servers, performance is worse with =4
    • see above for the discussion of cz11a vs cz11b
My previous post has more details on the challenges of trying to use similar my.cnf files across MySQL and MariaDB.

The Benchmark

The benchmark is run with 1 client and then 4 clients, a cached workload and a table per client. It is explained here.

The test server was named v7 here and is an ASUS PN53. It has 8 cores, 32G RAM, Ubuntu 22.04 and XFS using 1 m.2 device.

The benchmark steps are:

  • l.i0
    • insert X million rows per table into Y tables in PK order. Each table has a PK index but no secondary indexes. There is one connection per client. With 1 client the values of X and Y are 50M and 1. While with 4 clients the values are X=12M and Y=4.
  • l.x
    • create 3 secondary indexes per table. There is one connection per client.
  • l.i1
    • use 2 connections/client. One inserts 40M rows and the other does deletes at the same rate as the inserts. Each transaction modifies 50 rows (big transactions). This step is run for a fixed number of inserts, so the run time varies depending on the insert rate.
  • l.i2
    • like l.i1 but each transaction modifies 5 rows (small transactions) and 10M rows are inserted and deleted.
    • Wait for X seconds after the step finishes to reduce variance during the read-write benchmark steps that follow. The value of X is a function of the table size.
  • qr100
    • use 3 connections/client. One does range queries and performance is reported for this. The second does does 100 inserts/s and the third does 100 deletes/s. The second and third are less busy than the first. The range queries use covering secondary indexes. This step is run for 1800 seconds. If the target insert rate is not sustained then that is considered to be an SLA failure. If the target insert rate is sustained then the step does the same number of inserts for all systems tested.
  • qp100
    • like qr100 except uses point queries on the PK index
  • qr500
    • like qr100 but the insert and delete rates are increased from 100/s to 500/s
  • qp500
    • like qp100 but the insert and delete rates are increased from 100/s to 500/s
  • qr1000
    • like qr100 but the insert and delete rates are increased from 100/s to 1000/s
  • qp1000
    • like qp100 but the insert and delete rates are increased from 100/s to 1000/s
Results

The performance reports are here for:
The summary in each performance report has 3 tables. The first shows absolute throughput by DBMS tested X benchmark step. The second has throughput relative to the version from the first row of the table. The third shows the background insert rate for benchmark steps with background inserts and all systems sustained the target rates. The second table makes it easy to see how performance changes over time. The third table makes it easy to see which DBMS+configs failed to meet the SLA.

Below I use relative QPS to explain how performance changes. It is: (QPS for $me / QPS for $base) where $me is my version and $base is the version of the base case. When relative QPS is > 1.0 then performance improved over time. When it is < 1.0 then there are regressions. The Q in relative QPS measures: 
  • insert/s for l.i0, l.i1, l.i2
  • indexed rows/s for l.x
  • range queries/s for qr100, qr500, qr1000
  • point queries/s for qp100, qp500, qp1000
Below I use colors to highlight the relative QPS values with red for <= 0.95, green for >= 1.05 and grey for values between 0.95 and 1.05.

Results: MariaDB vs MySQL

MariaDB is much better at avoiding regressions than MySQL and the result over time means that MariaDB is now faster than MySQL on all of the benchmark steps. The results are similar between innodb_purge_threads =1 and =4 so I focus on =4.

In both cases (1 client, 4 clients) the base case is MariaDB 10.11.7 with the cz11a_c8r32 config (ma101107_rel.cz11a_c8r32). It is compared with:
  • MariaDB 11.4.1 with the cz11b_c8r32 config (ma110401_rel.cz11b_c8r32)
  • MySQL 8.0.36 with the cz11a_c8r32 config (my8036_rel.cz11a_c8r32)
From the summary for 1 client the relative throughput per benchmark step is:
  • l.i0
    • relative QPS is 1.02 in MariaDB 11.4.1
    • relative QPS is 0.62 in MySQL 8.0.36
  • l.x - I ignore this for now
  • l.i1, l.i2
    • relative QPS is 0.92, 0.97 in MariaDB 11.4.1
    • relative QPS is 0.86, 0.78 in MySQL 8.0.36
  • qr100, qr500, qr1000
    • relative QPS is 1.00, 1.02, 1.01 in MariaDB 11.4.1
    • relative QPS is 0.98, 1.00, 0.99 in MySQL 8.0.36
  • qp100, qp500, qp1000
    • relative QPS is 1.01, 1.00, 1.01 in MariaDB 11.4.1
    • relative QPS is 0.84, 0.84, 0.85 in MySQL 8.0.36
From the summary for 4 clients the relative throughput per benchmark step is:
  • l.i0
    • relative QPS is 1.00 in MariaDB 11.4.1
    • relative QPS is 0.80 in MySQL 8.0.36
  • l.x - I ignore this for now
  • l.i1, l.i2
    • relative QPS is 0.83, 0.97 in MariaDB 11.4.1
    • relative QPS is 0.50, 0.52 in MySQL 8.0.36
  • qr100, qr500, qr1000
    • relative QPS is 1.00, 0.99, 1.00 in MariaDB 11.4.1
    • relative QPS is 0.98, 0.98, 0.98 in MySQL 8.0.36
  • qp100, qp500, qp1000
    • relative QPS is 1.00, 1.00, 1.00 in MariaDB 11.4.1
    • relative QPS is 0.85, 0.84, 0.85 in MySQL 8.0.36
Results: MariaDB

MariaDB 11.4.1 compared to 10.2.44 is up to 11% slower on the intiial load (l.i0), up to 26% faster on the write heavy steps (l.i1, l.i2) and up to 9% slower on the read-write steps (qr*, qp*). It has done a great job at avoiding regressions.

The results are similar between innodb_purge_threads =1 and =4 so I focus on =4.

In both cases (1 client, 4 clients) the base case is MariaDB 10.2.44 with the cz11a_c8r32 config (ma100244_rel.cz11a_c8r32). It is compared with:
  • MariaDB 10.11.7 with the cz11a_c8r32 config (ma101107_rel.cz11a_c8r32)
  • MariaDB 11.4.1 with the cz11b_c8r32 config (ma110401_rel.cz11b_c8r32)
From the summary for 1 client the relative throughput per benchmark step is:
  • l.i0
    • relative QPS is 0.93 in MariaDB 10.11.7
    • relative QPS is 0.95 in MariaDB 11.4.1
  • l.x - I ignore this for now
  • l.i1, l.i2
    • relative QPS is 1.13, 1.26 in MariaDB 10.11.7
    • relative QPS is 1.05, 1.22 in MariaDB 11.4.1
  • qr100, qr500, qr1000
    • relative QPS is 0.92, 0.91, 0.93 in MariaDB 10.11.7
    • relative QPS is 0.92, 0.93, 0.93 in MariaDB 11.4.1
  • qp100, qp500, qp1000
    • relative QPS is 0.93, 0.94, 0.94 in MariaDB 10.11.7
    • relative QPS is 0.93, 0.94, 0.95 in MariaDB 11.4.1
From the summary for 4 clients the relative throughput per benchmark step is:
  • l.i0
    • relative QPS is 0.89 in MariaDB 10.11.7
    • relative QPS is 0.89 in MariaDB 11.4.1
  • l.x - I ignore this for now
  • l.i1, l.i2
    • relative QPS is 1.32, 1.22 in MariaDB 10.11.7
    • relative QPS is 1.10, 1.18 in MariaDB 11.4.1
  • qr100, qr500, qr1000
    • relative QPS is 0.94, 0.98, 0.99 in MariaDB 10.11.7
    • relative QPS is 0.94, 0.97, 0.99 in MariaDB 11.4.1
  • qp100, qp500, qp1000
    • relative QPS is 0.93, 0.96, 0.98 in MariaDB 10.11.7
    • relative QPS is 0.93, 0.96, 0.97 in MariaDB 11.4.1
Results: MySQL

There are large regressions from MySQL 5.6.51 to 5.7.44 and then again from 5.7.44 to 8.0.36. In the worst case 5.6.51 is almost 2X faster than 8.0.36 and in most cases 8.0.36 is 15% to 30% slower than 5.6.51. The results are similar between innodb_purge_threads =1 and =4 so I focus on =4.

In both cases (1 client, 4 clients) the base case is MySQL 5.6.51 with the cz11a_c8r32 config (my5651_rel.cz11a_c8r32). It is compared with:
  • MySQL 5.7.44 with the cz11a_c8r32 config (my5744_rel.cz11a_c8r32)
  • MySQL 8.0.36 with the cz11a_c8r32 config (my8036_rel.cz11a_c8r32)
From the summary for 1 client the relative throughput per benchmark step is:
  • l.i0
    • relative QPS is 0.86 in MySQL 5.7.44
    • relative QPS is 0.56 in MySQL 8.0.36
  • l.x - I ignore this for now
  • l.i1, l.i2
    • relative QPS is 1.06, 1.00 in MySQL 5.7.44
    • relative QPS is 0.98, 0.84 in MySQL 8.0.36
  • qr100, qr500, qr1000
    • relative QPS is 0.84, 0.85, 0.83 in MySQL 5.7.44
    • relative QPS is 0.75, 0.76, 0.75 in MySQL 8.0.36
  • qp100, qp500, qp1000
    • relative QPS is 0.89, 0.87, 0.87 in MySQL 5.7.44
    • relative QPS is 0.71, 0.70, 0.70 in MySQL 8.0.36
From the summary for 4 clients the relative throughput per benchmark step is:
  • l.i0
    • relative QPS is 1.05 in MySQL 5.7.44
    • relative QPS is 0.79 in MySQL 8.0.36
  • l.x - I ignore this for now
  • l.i1, l.i2
    • relative QPS is 1.30, 1.31 in MySQL 5.7.44
    • relative QPS is 0.80, 0.77 in MySQL 8.0.36
  • qr100, qr500, qr1000
    • relative QPS is 0.85, 0.86, 0.86 in MySQL 5.7.44
    • relative QPS is 0.76, 0.76, 0.77 in MySQL 8.0.36
  • qp100, qp500, qp1000
    • relative QPS is 0.87, 0.87, 0.87 in MySQL 5.7.44
    • relative QPS is 0.69, 0.69, 0.70 in MySQL 8.0.36


CPU-bound sysbench on a large server: Postgres 12 to 19 beta1

This has results from sysbench on a small server with Postgres versions 12 through 19 beta1. Sysbench is run with high concurrency (40 conne...